Figure 5.18
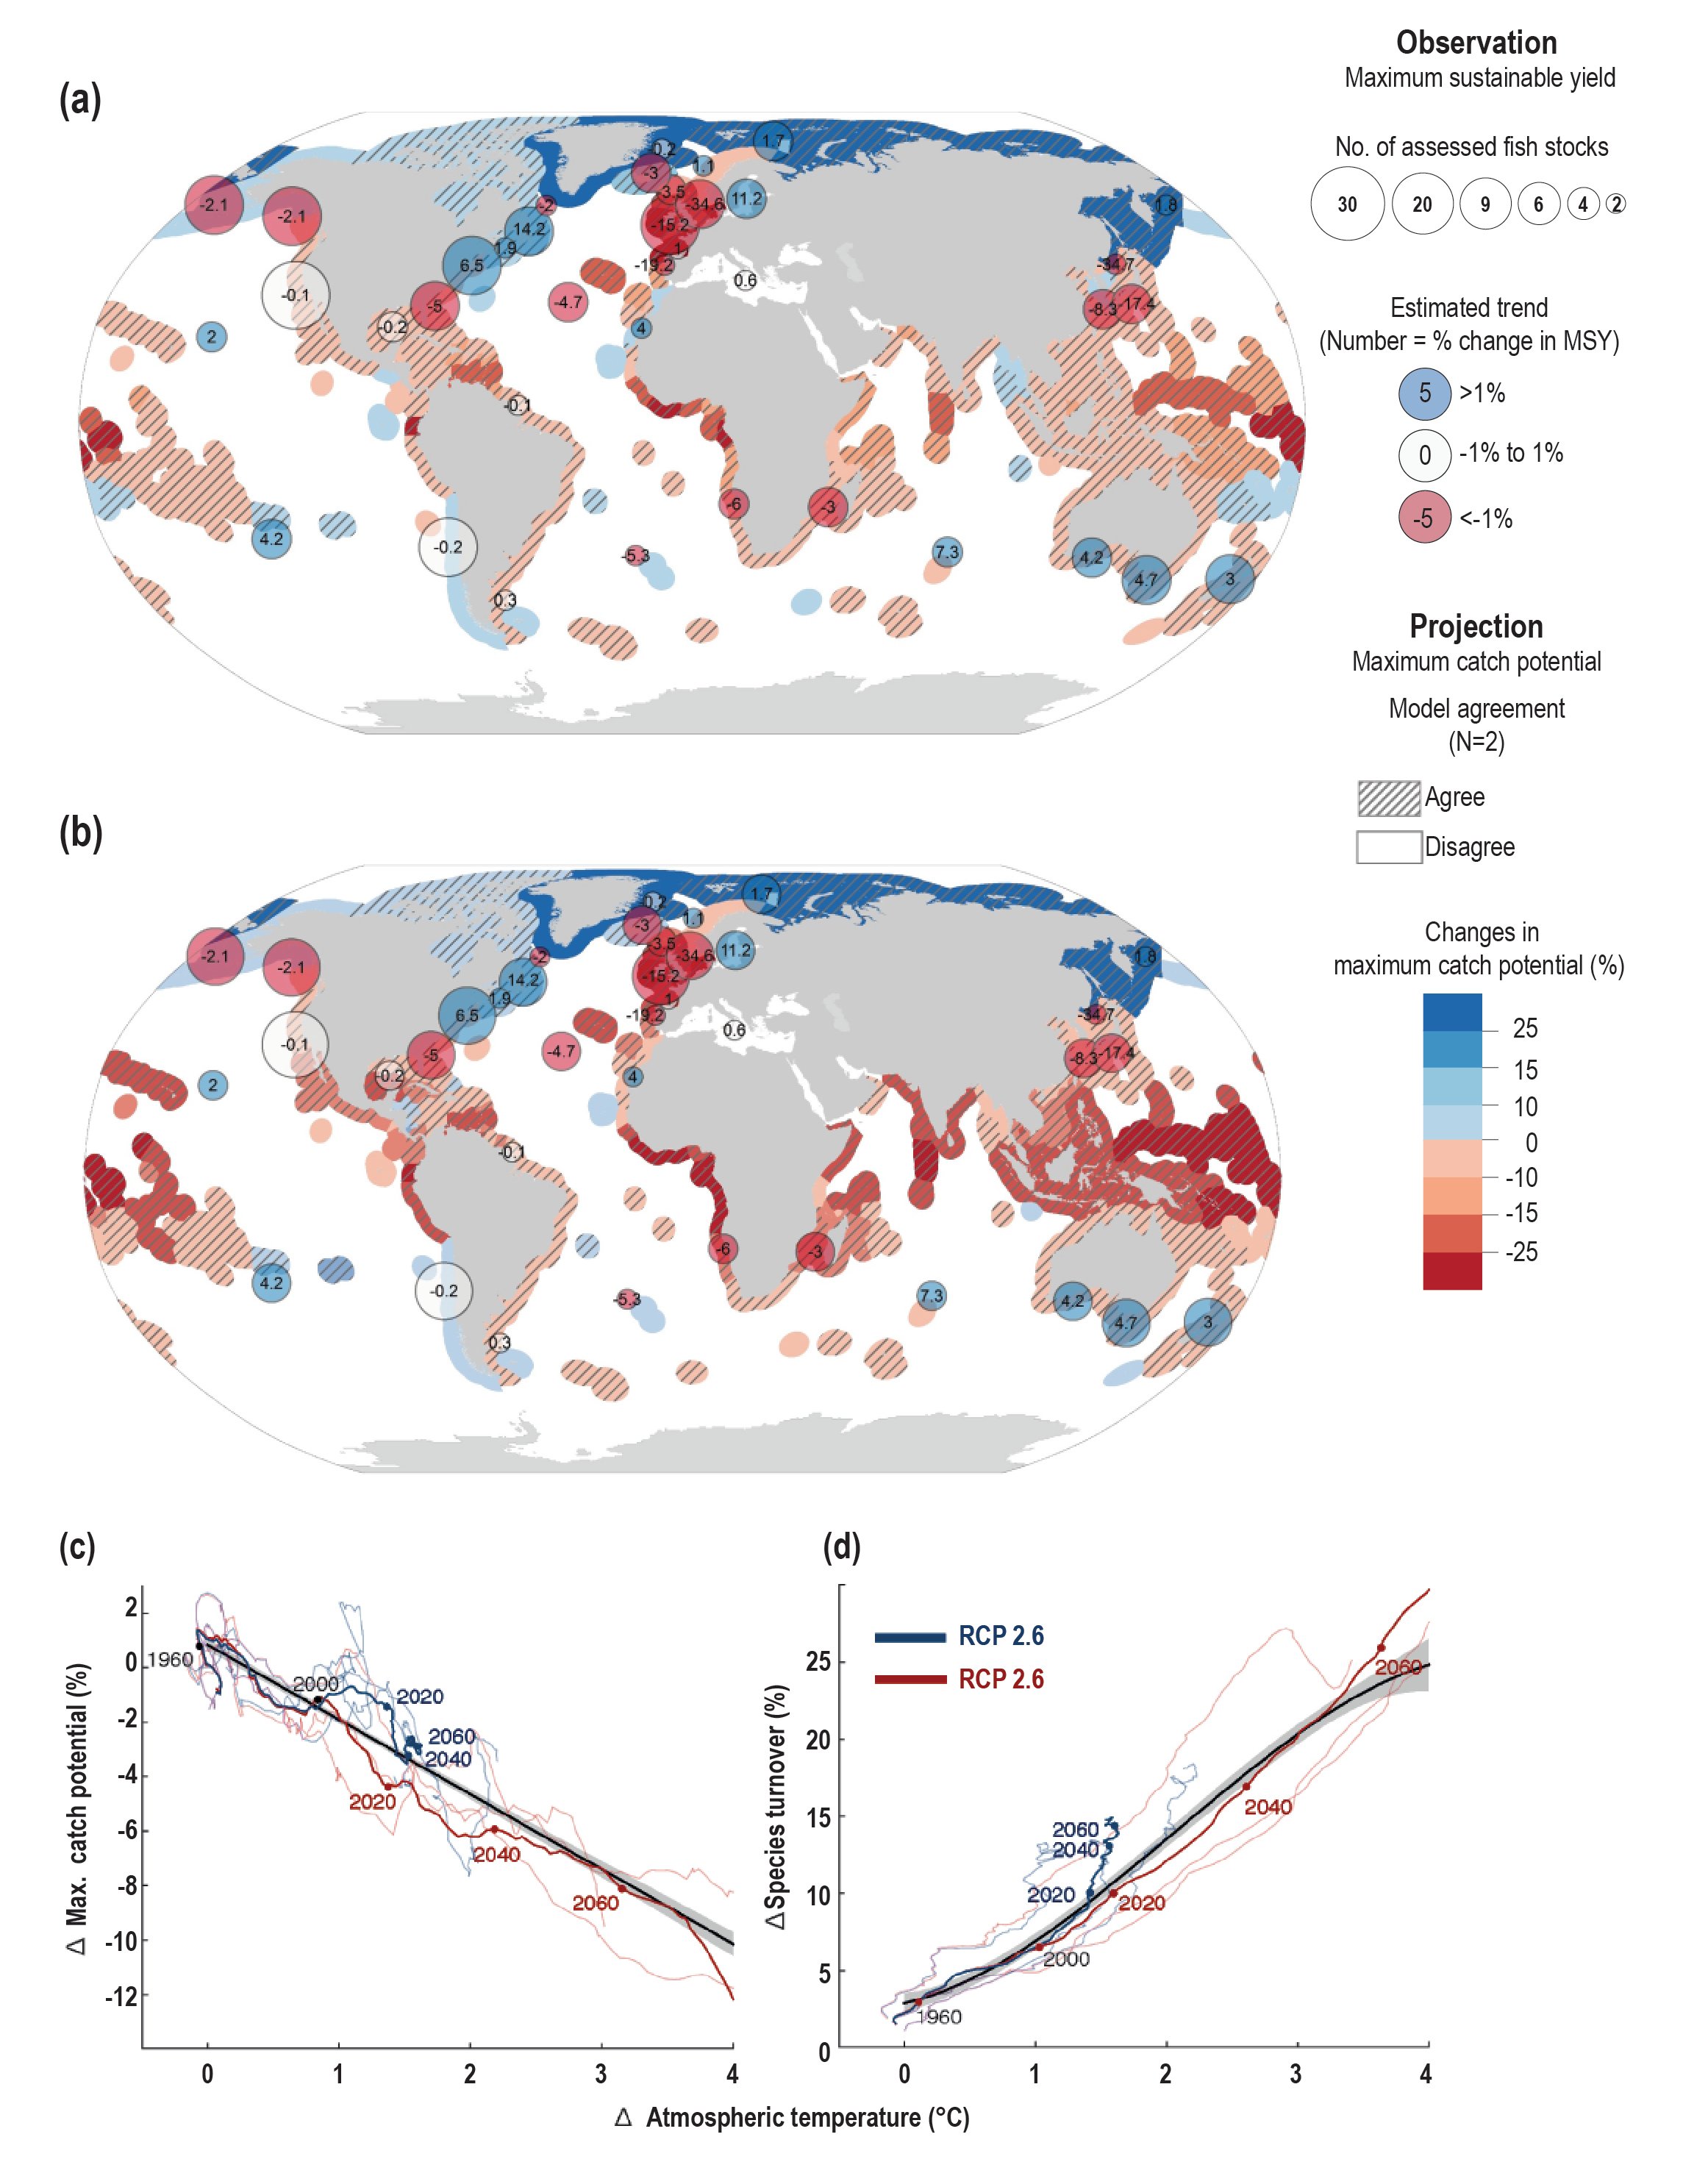
Figure 5.18 | Historical and projected maximum sustainable yield (MSY) and maximum fish catch potential by region. Historical trends in MSY is based on time series of fish stock assessment data (Free et al. 2019) represented as circles in panels (a) and (b). The size of the circle represents the number of assessed fish stocks while the number in the circle represents the estimated percent change in MSY since the 1930s. Projected changes in maximum catch potential by 2050 (average between 2041–2060) relative to 2000 (1991–2010) under (a) RCP2.6 and (b) RCP8.5 scenarios from two models: Dynamic Bioclimate Envelope Model and dynamic size-spectrum foodweb model with the colour in each ocean region representing the projected level of change and the shading representing where both models agree in the direction of change (Cheung et al. 2018a). Also presented is the scaling between projected global atmospheric warming (relative to 1950–1961) and (c) changes in maximum fish catch potential and (d) species turnover using the Dynamic Bioclimate Envelope Model and outputs from three Coupled Model Intercomparison Project Phase 5 (CMIP5) Earth System Models (ESMs) (Cheung and Pauly, 2016). Model projections (a,b) are provided by Plymouth Marine Laboratory, Euro-Meditteranean Centre for Climate Change and Fisheries and Marine Ecosystem Impact Model Intercomparison Project (FISHMIP) of coastal ecosystems.