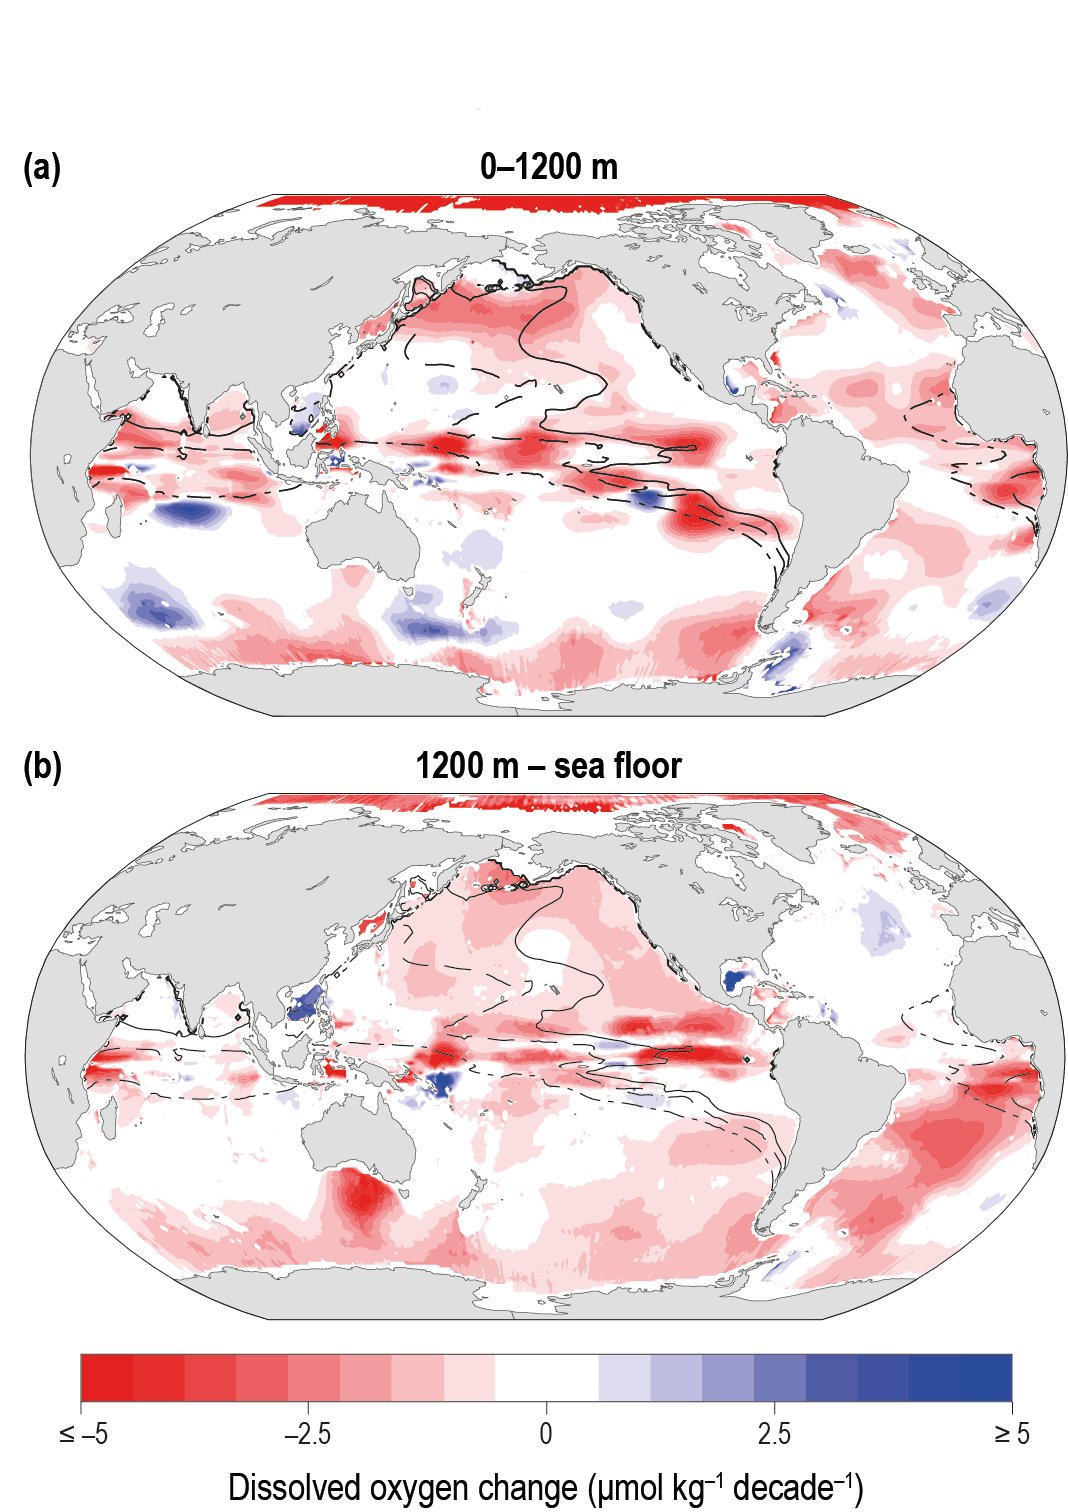
Figure 5.9 | Absolute change in dissolved oxygen (umol kg–1 per decade) between water depths of (a) 0 and 1200 m, and (b) 1200 m and the sea floor over the period 1960–2010. Lines indicate boundaries of OMZs with less than 80 μ mol kg–1 oxygen anywhere within the water column (dashed/dotted), less than 40 μ mol kg–1 (dashed) and less than 20 μ mol kg–1 (solid). Redrawn from Oschlies et al. (2018).