Figure 5.8
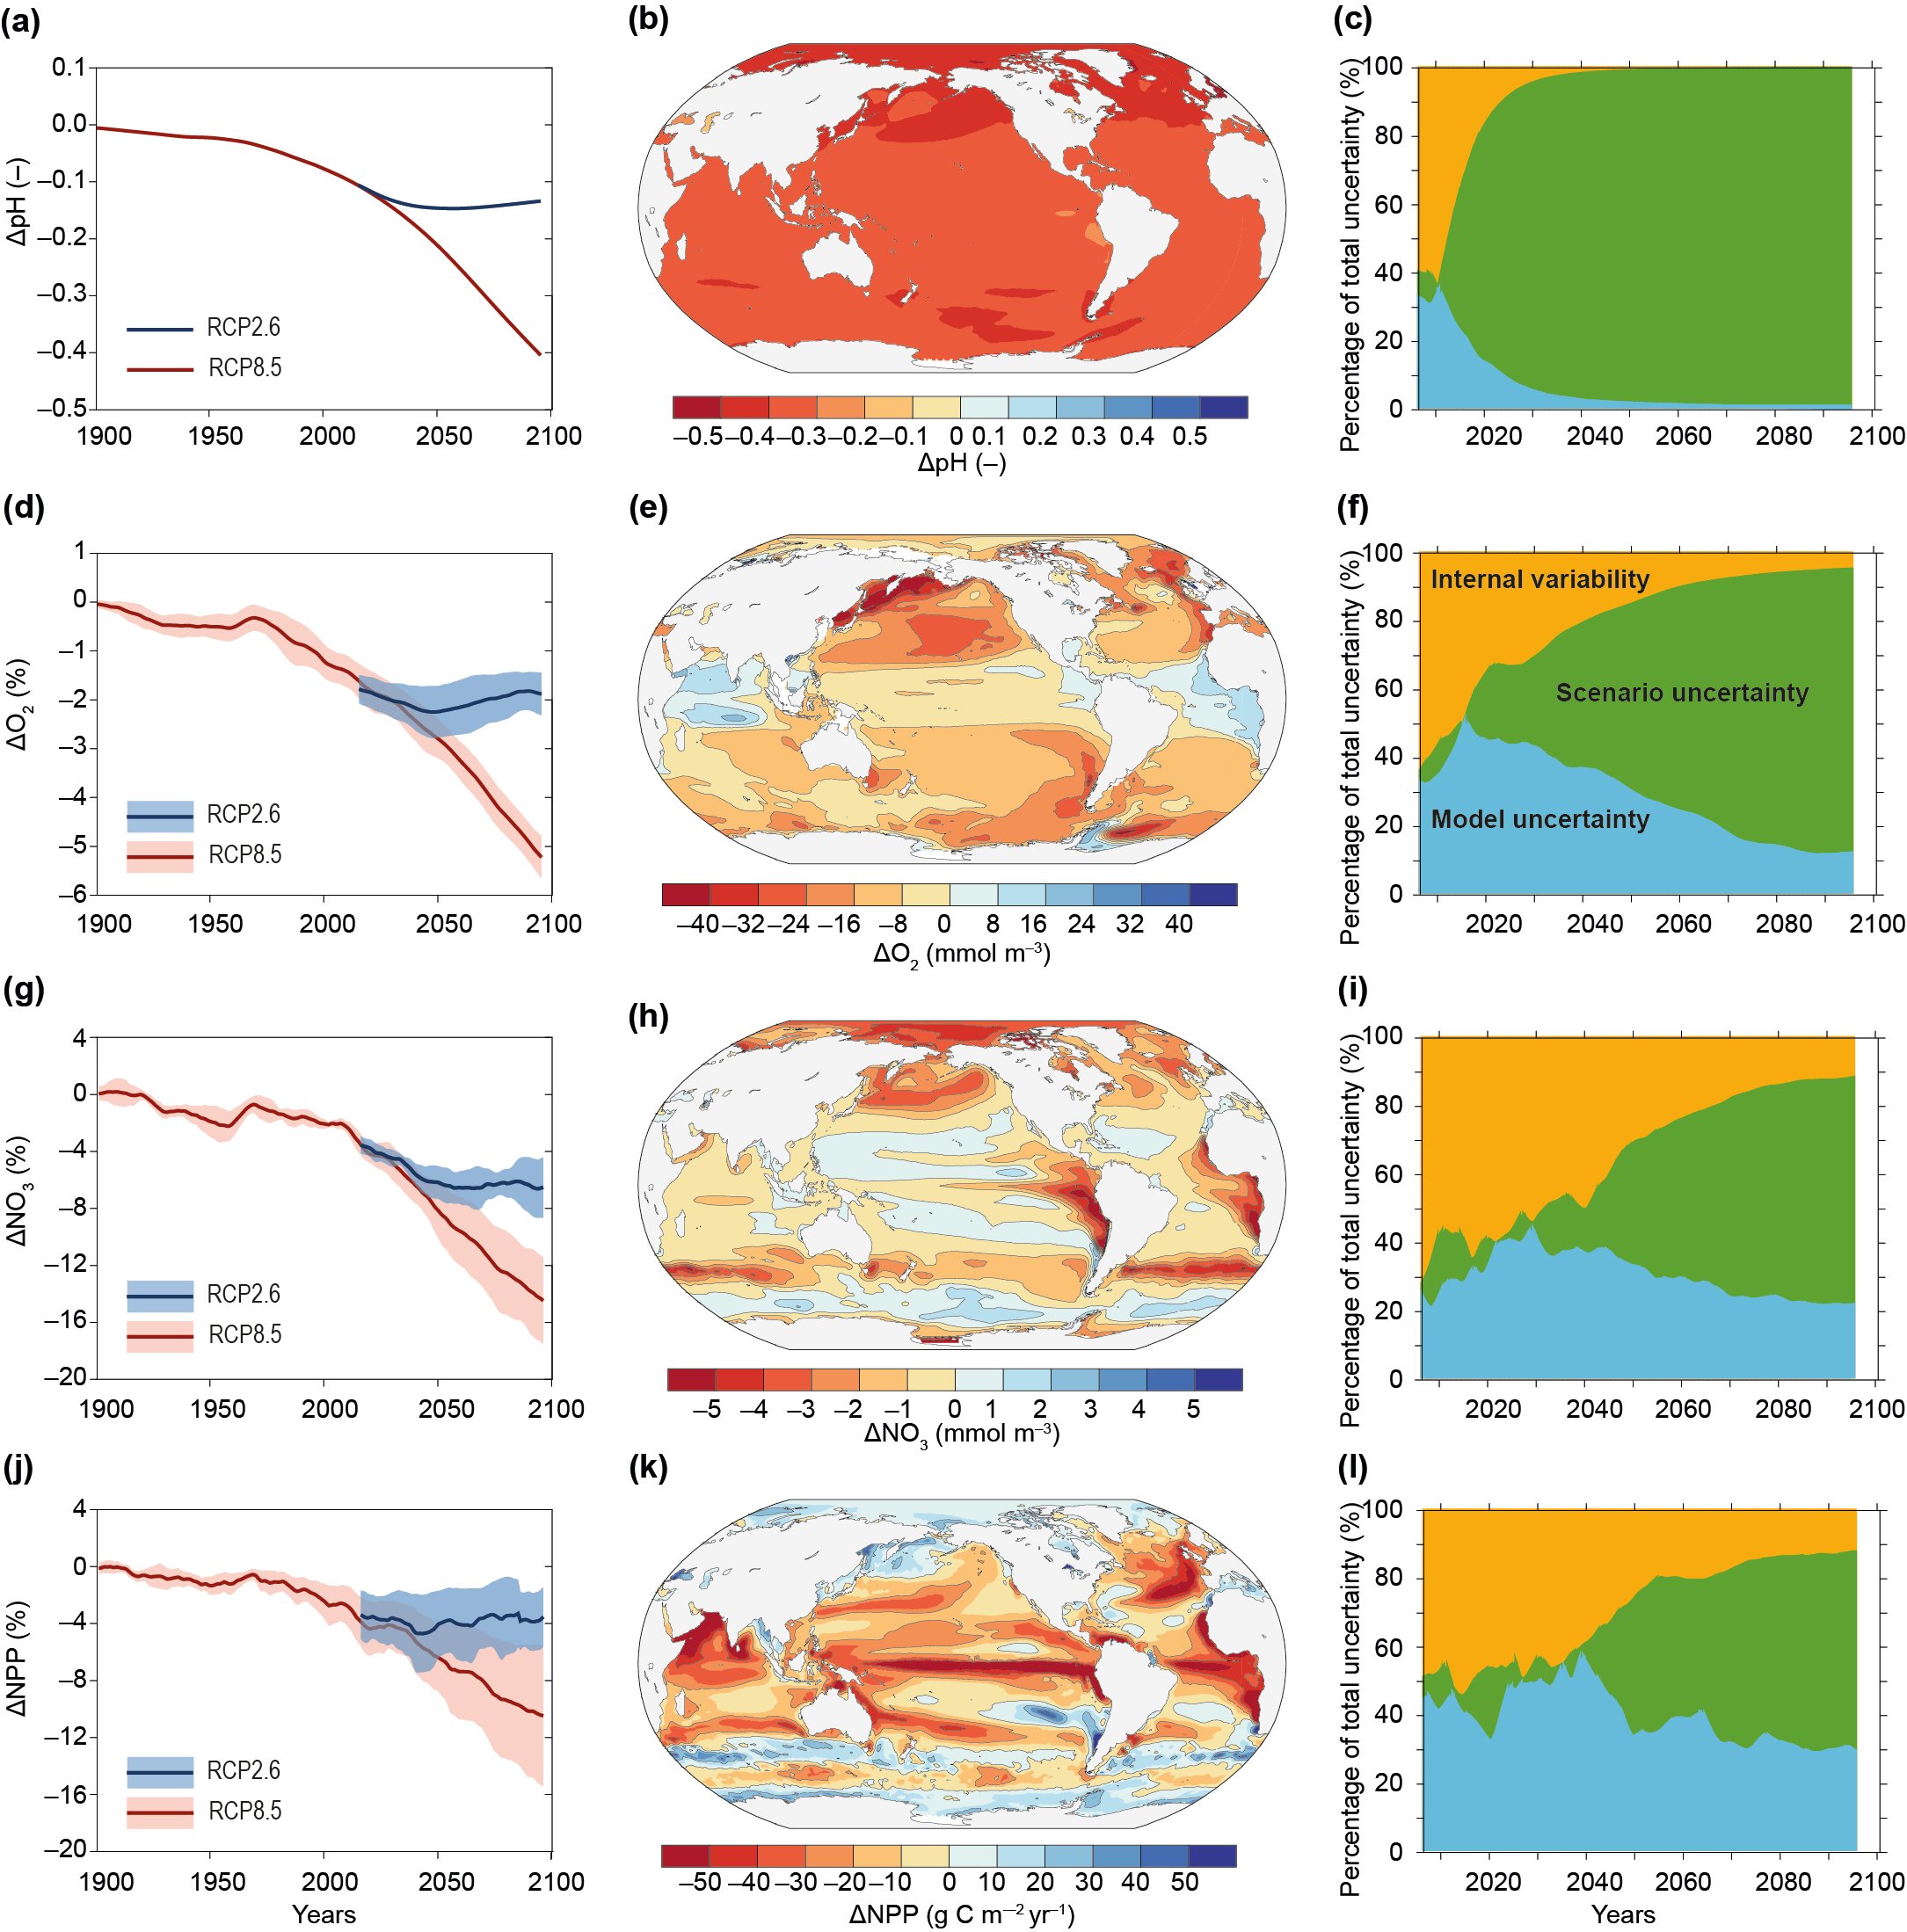
Figure 5.8 | Panels a, d, g and j display simulated global changes over the period of 1900–2100 (with solid lines representing the multi-model mean and the envelope representing 90% confidence intervals for RCP8.5 and RCP2.6), for surface pH, O2 concentration averaged over 100–600 m depth, upper 100 m nitrate concentrations and NPP integrated over the top 100 m. Differences are calculated relative to the 1850–1900 period. Panels b, e, h and k show spatial patterns of simulated change in surface pH, upper 100 m nitrate concentrations, O2 concentration averaged over 100 to 600 m depth, and NPP integrated over the top 100 m averaged over 2081–2100, relative to 1850–1900 for RCP8.5. Panels c, f, i and l display time series of the percentage of total uncertainty ascribed to internal variability uncertainty, model uncertainty, and scenario uncertainty in projections of global annual mean changes. Figure adapted after (Frölicher et al. 2016). Please note that confidence intervals can be affected by the different number of models available for the RCP8.5 and RCP2.6 scenarios and for different variables. See also Table SM5.4.