Figure 4.6
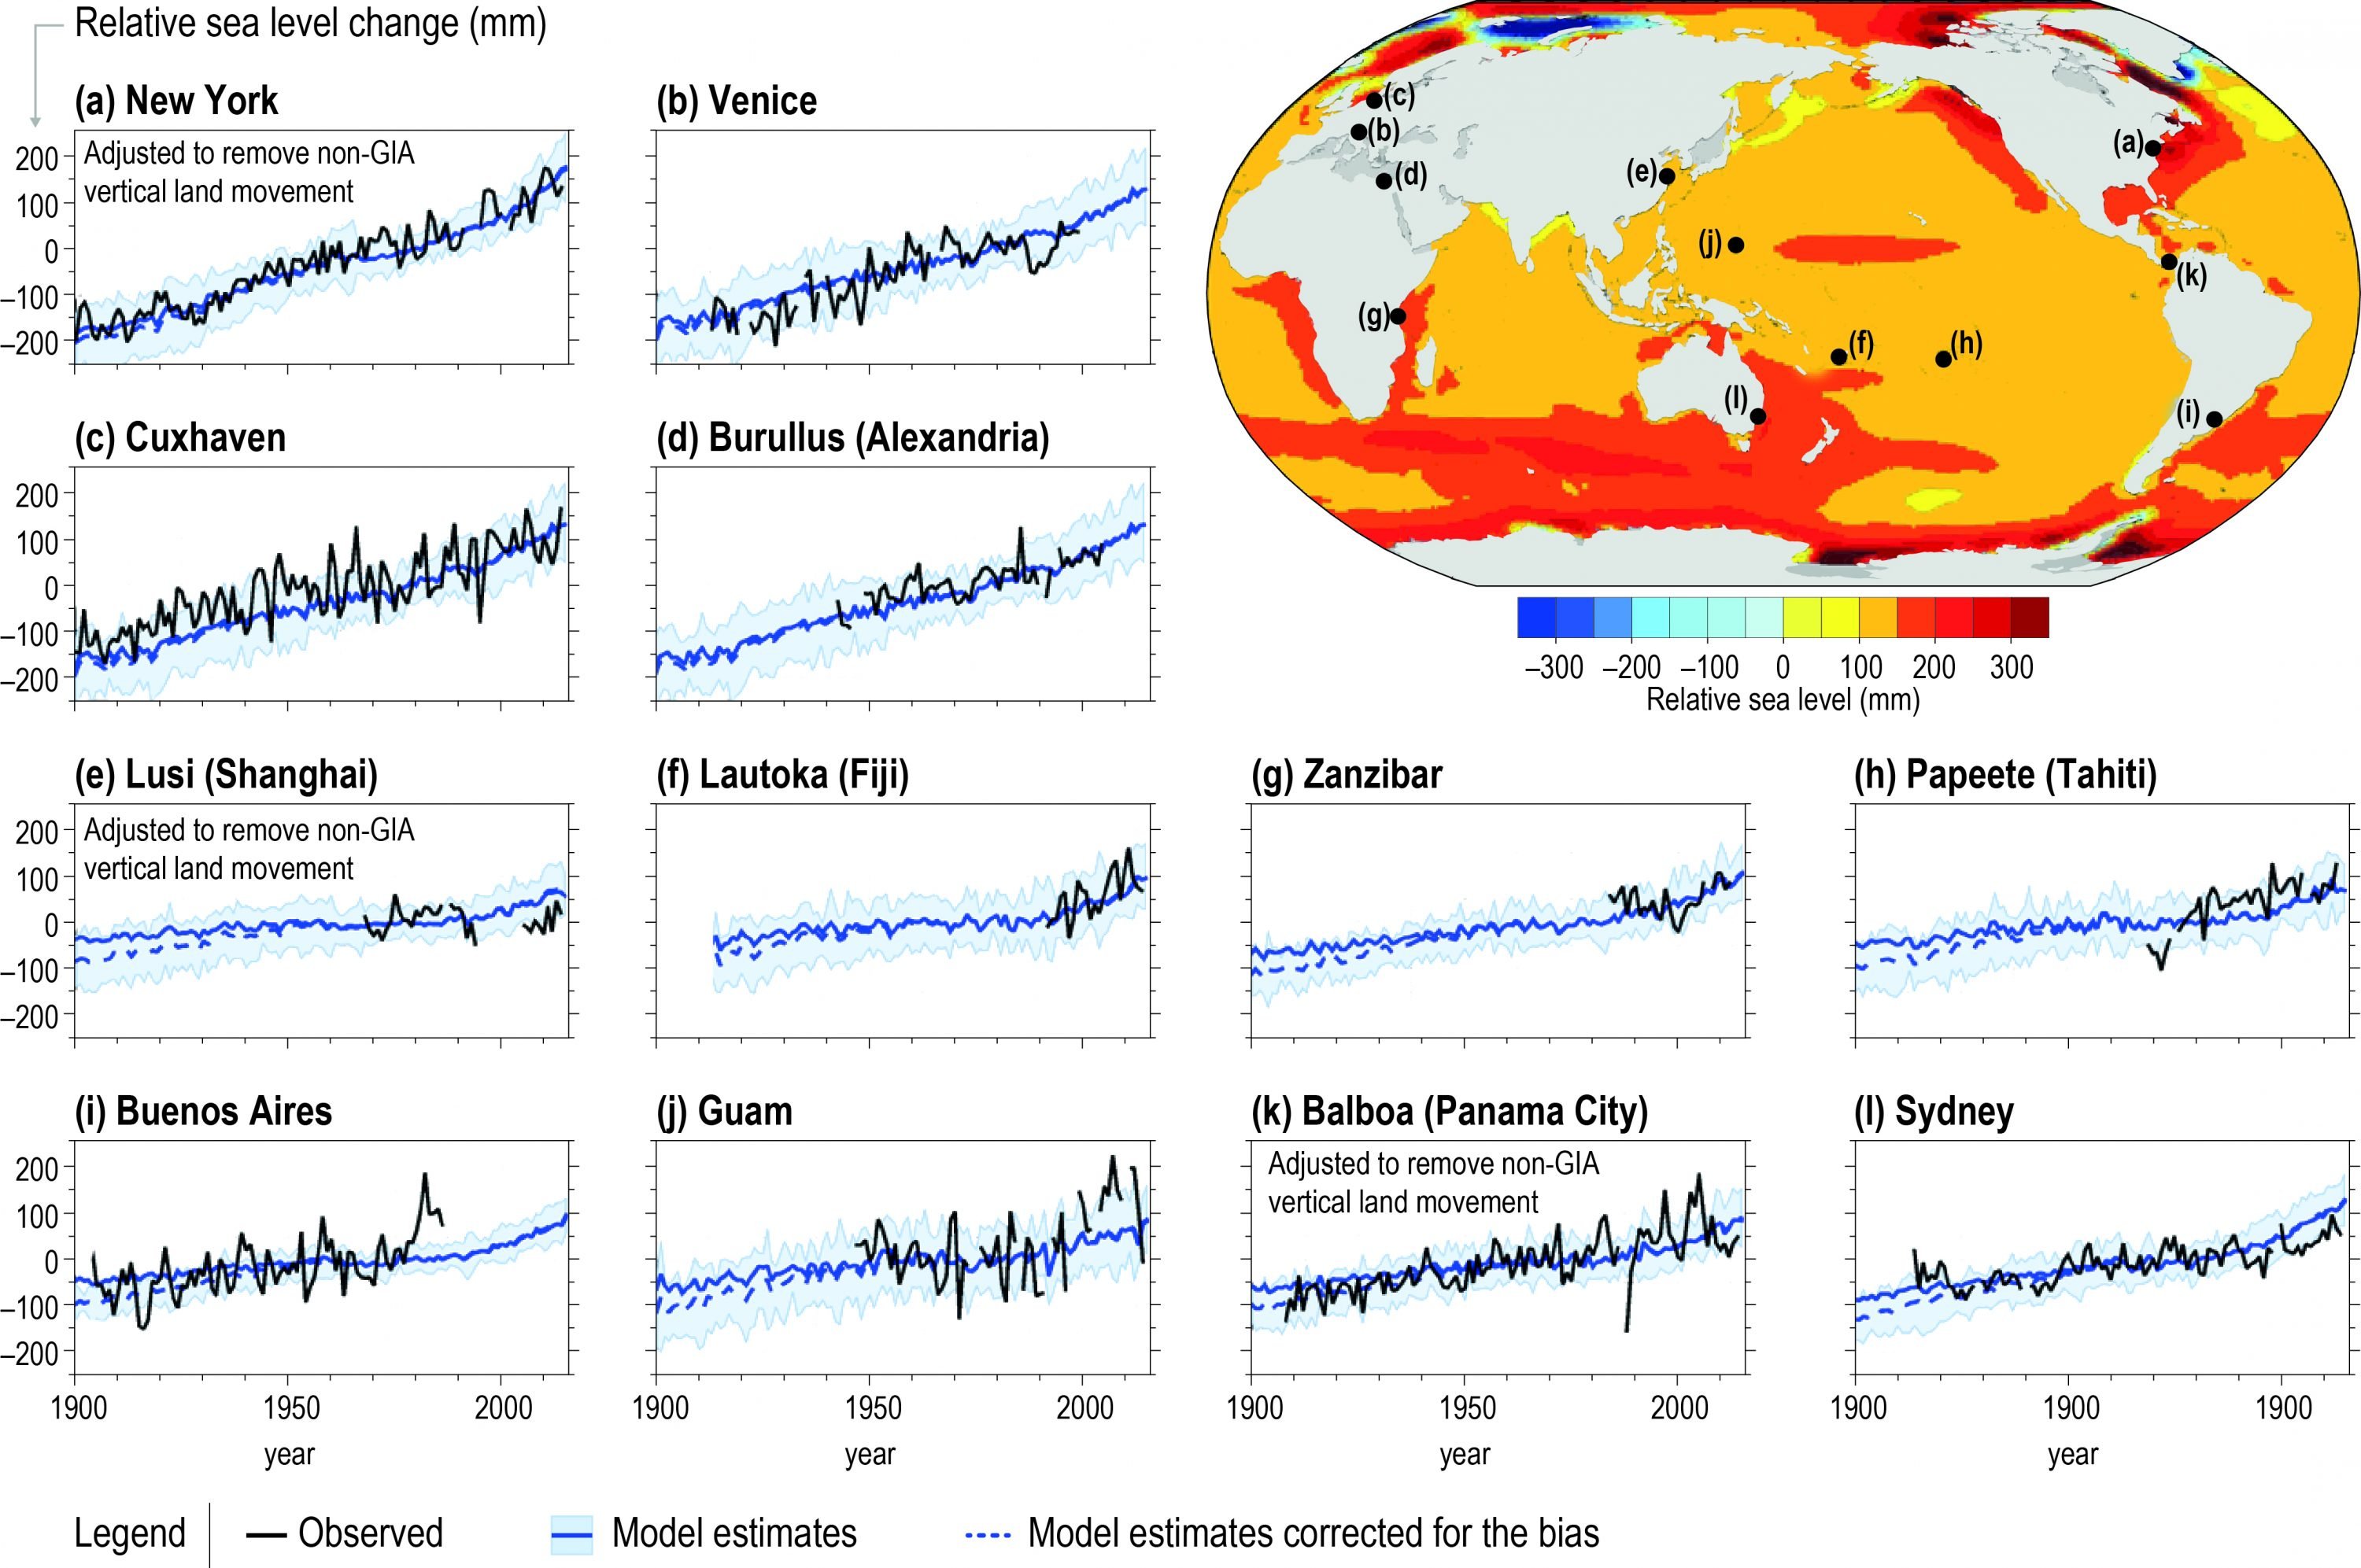
Figure 4.6 | 20th century simulated regional sea level changes by coupled climate models and comparison with a selection of local tide gauge time series. In the upper left corner: map of changes in simulated relative sea level (RSL) for the period 1901–1920 to 1996–2015 estimated from climate model outputs. Insets: Observed RSL changes (black lines) from selected tide gauge stations for the period 1900–2015. For comparison, the estimate of the simulated RSL change at the tide gauge station is also shown (blue plain line for the model estimates and blue dashed line for the model estimates corrected for the bias in glaciers mass loss and Greenland surface mass balance (SMB) over 1900–1940, see Section 4.2.2.2.6). The relatively large, short-term oscillations in observed local sea level (black lines) are due to the natural internal climate variability. For Mediterranean tide gauges, that is, Venice and Alexandria, the local simulated sea level has been computed with the simulated sea level in the Atlantic ocean at the entrance of the strait of Gibraltar following (Adloff et al., 2018). Tide gauge records have been corrected for vertical land motion (VLM) not associated with GIA where available, that is, for New York, Balboa and Lusi. Updated from Meyssignac et al. (2017b) to mimic RSL as good as possible.