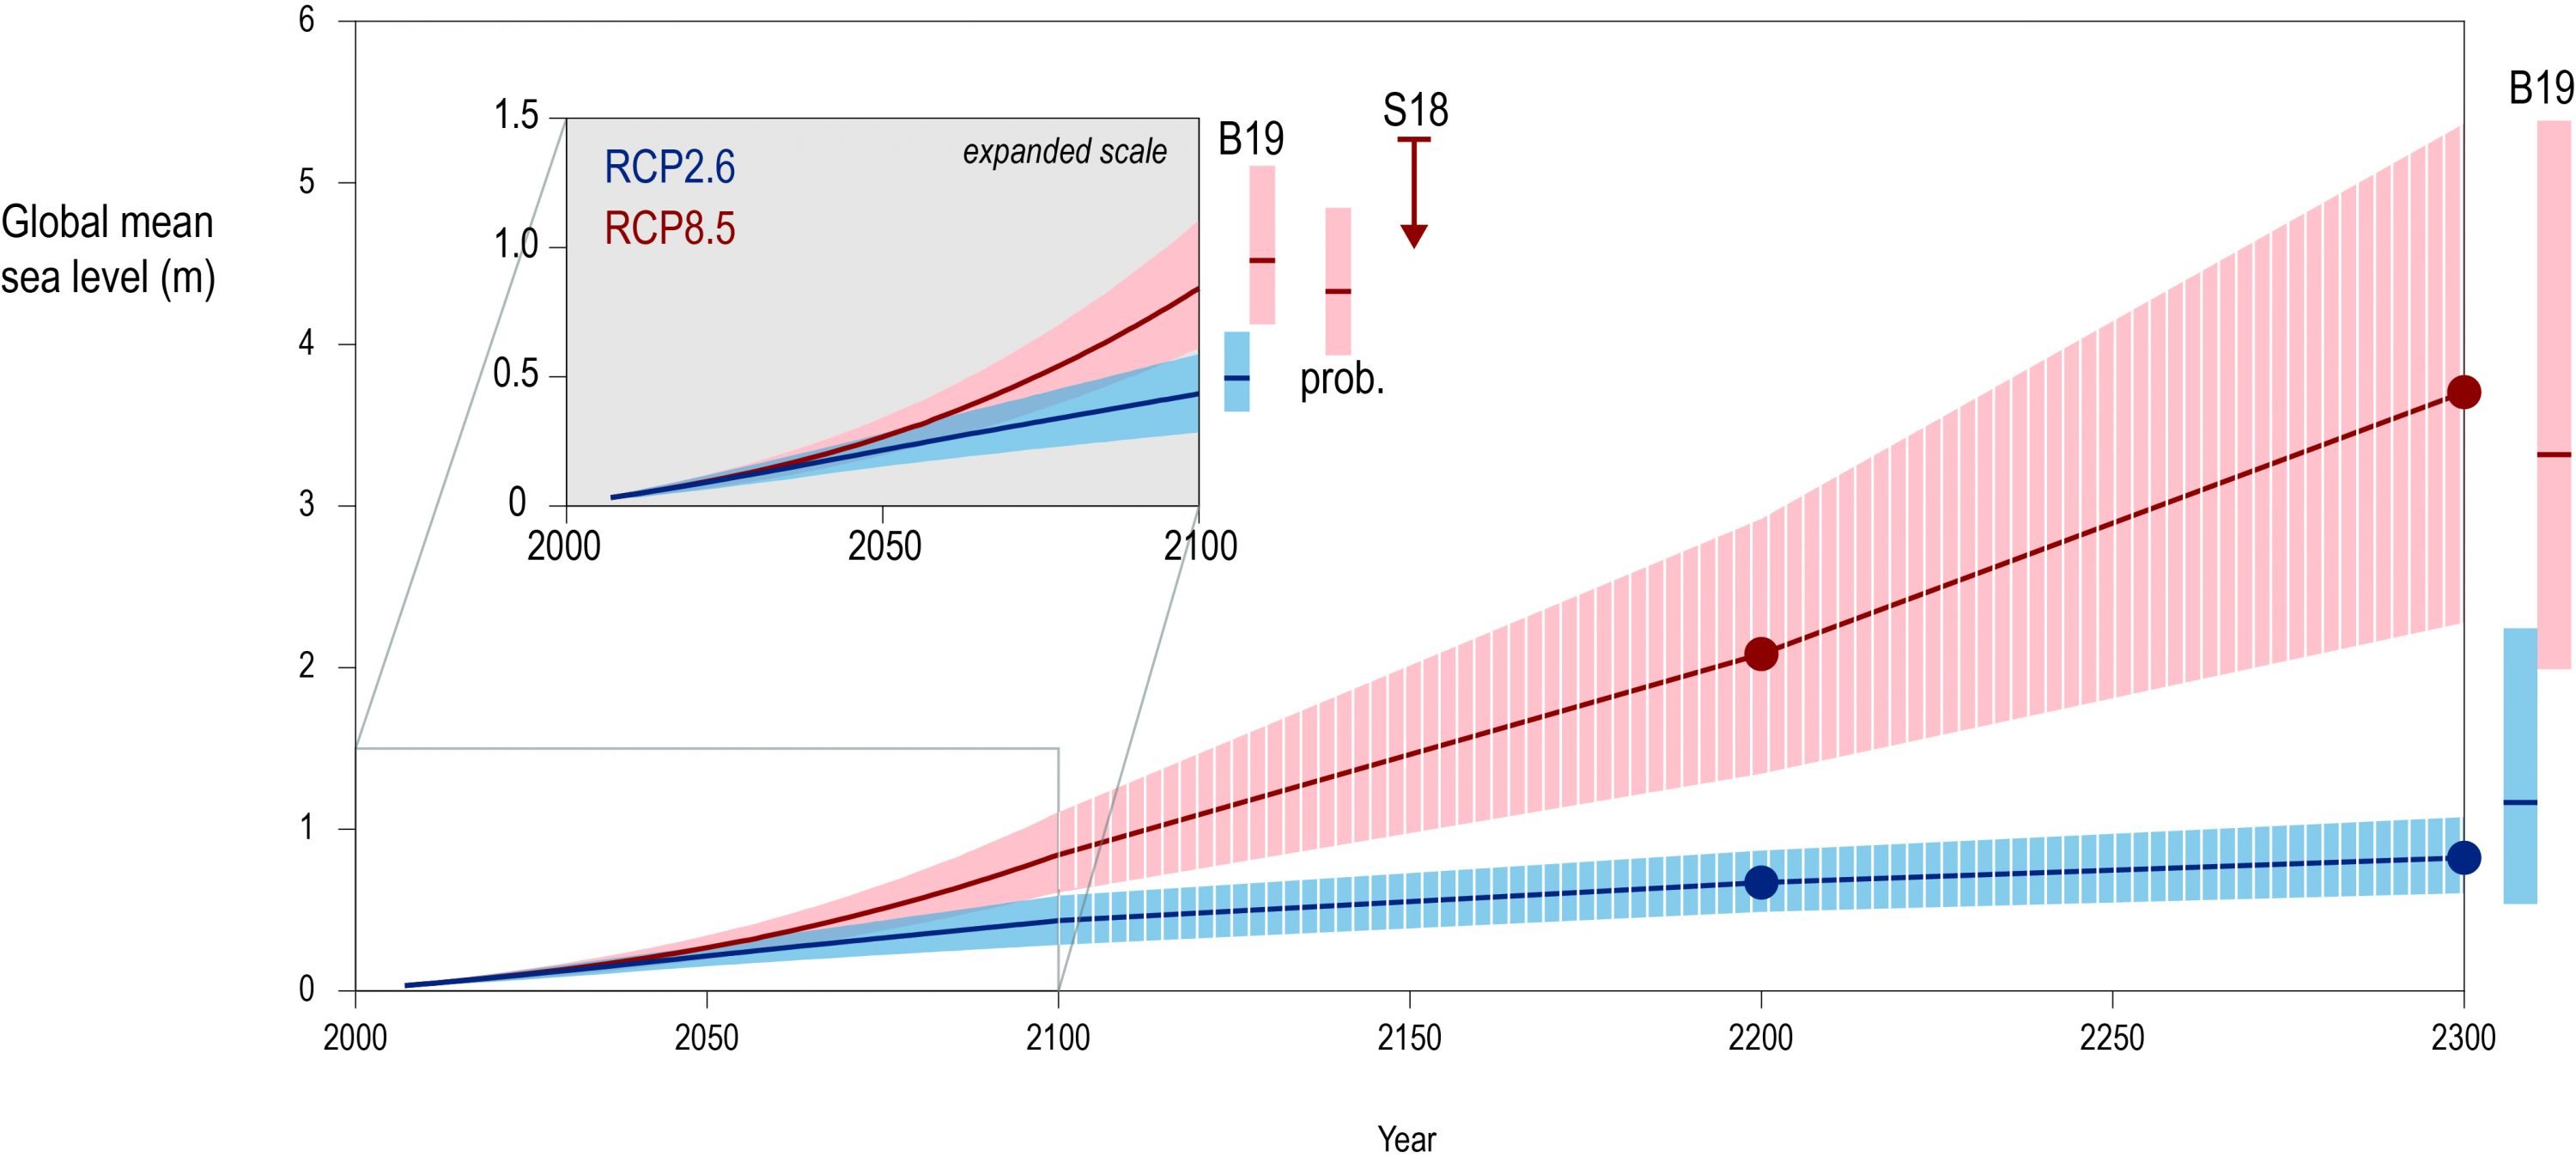
Figure 4.2
Figure 4.2 | Projected sea level rise (SLR) until 2300. The inset shows an assessment of the likely range of the projections for RCP2.6 and RCP8.5 up to 2100 (medium confidence). Projections for longer time scales are highly uncertain but a range is provided (4.2.3.6; low confidence). For context, results are shown from other estimation approaches in 2100 and 2300. The two sets of two bars labelled B19 are from an expert elicitation for the Antarctic component (Bamber et al., 2019), and reflect the likely range for a 2oC and 5oC temperature warming (low confidence; details section 4.2.3.3.1). The bar labelled “prob.” indicates the likely range of a set of probabilistic projections (4.2.3.2). The arrow indicated by S18 shows the result of an extensive sensitivity experiment with a numerical model for the Antarctic Ice Sheet (AIS) combined, like the results from B19 and “prob.”, with results from Church et al. (2013) for the other components of SLR. S18 also shows the likely range.