Figure 3.11
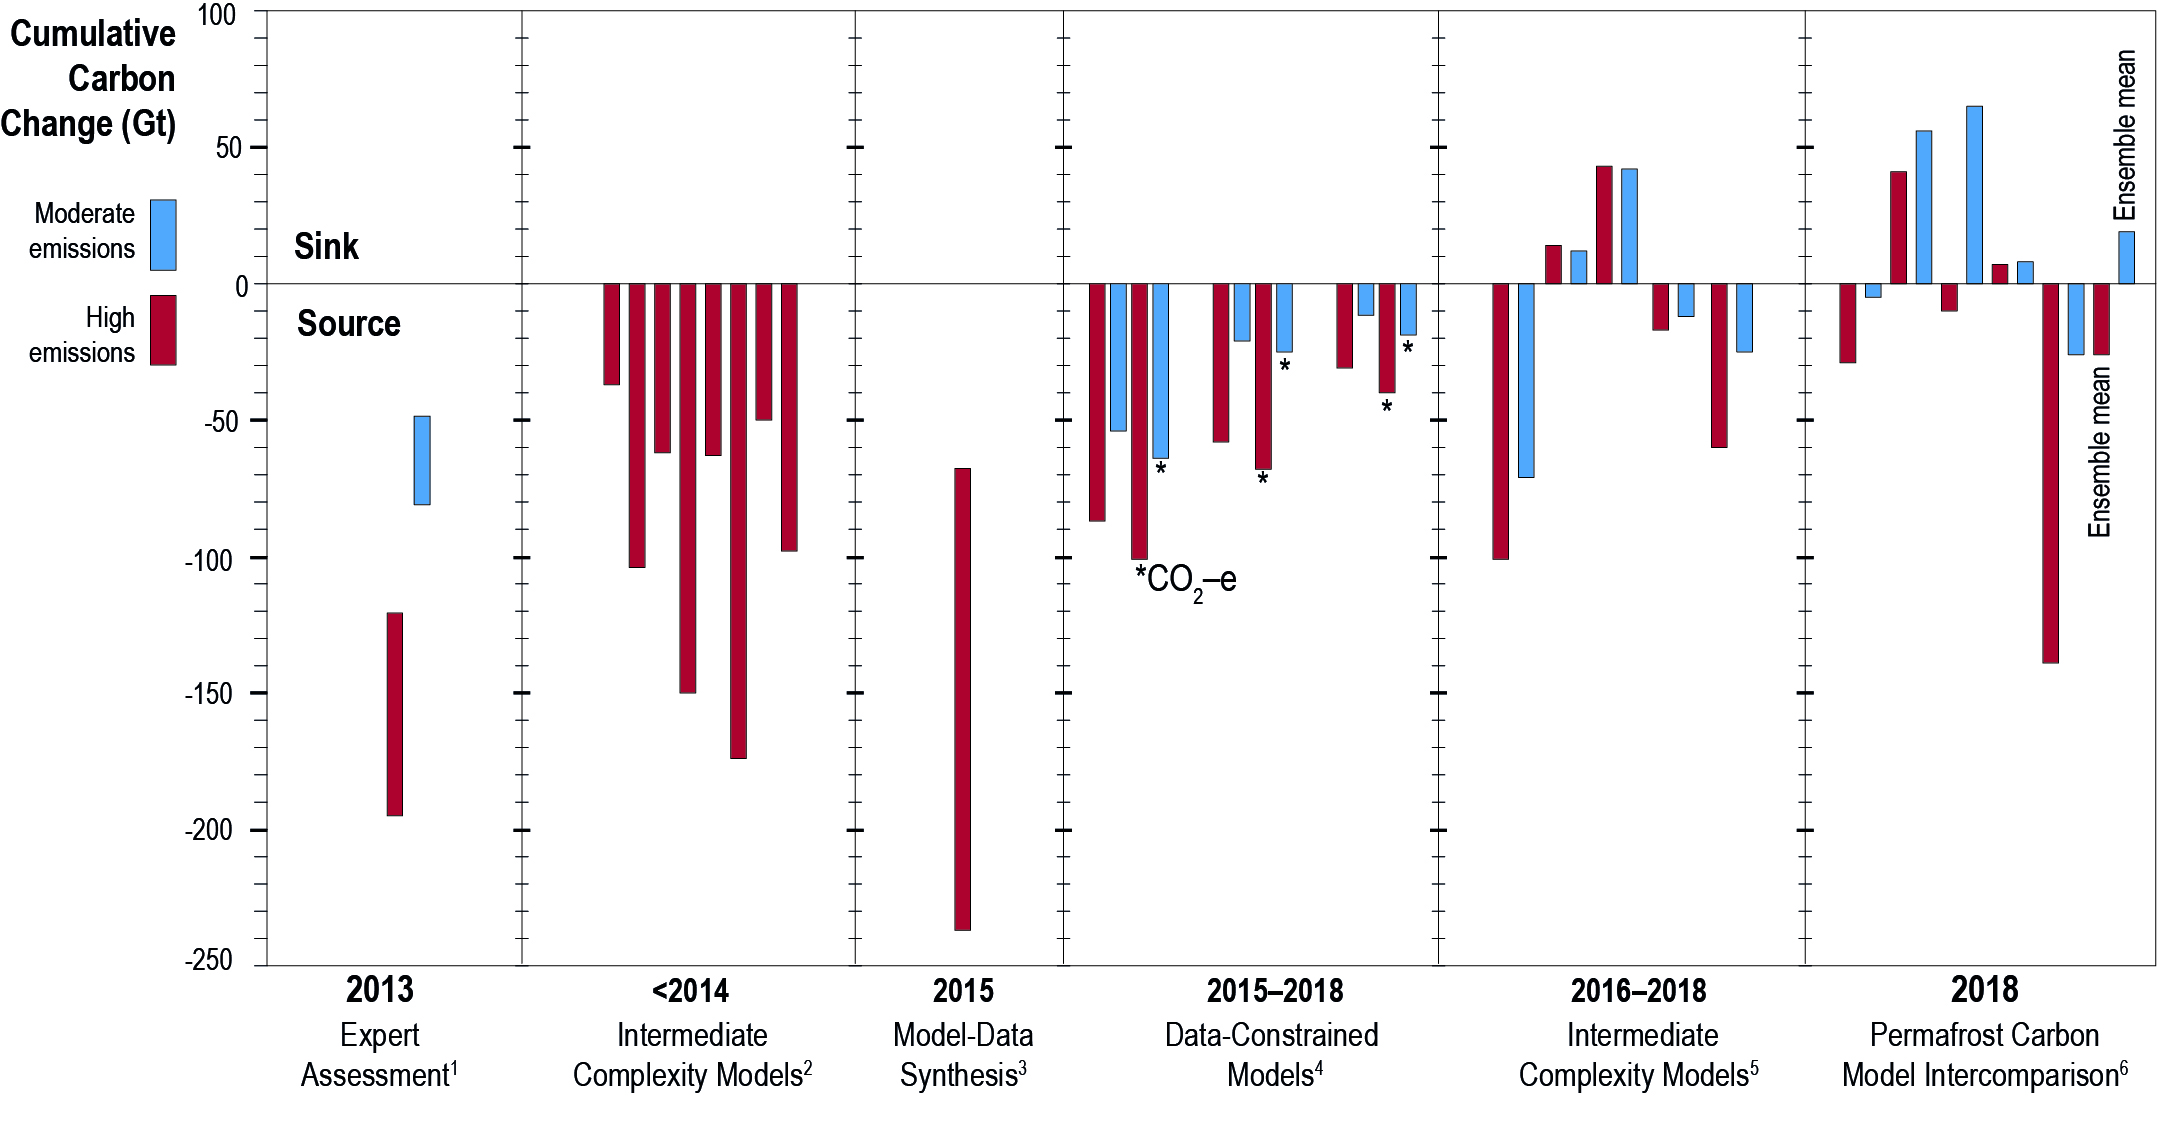
Figure 3.11 | Estimates of cumulative net soil carbon pool change for the northern circumpolar permafrost region by 2100 following medium and high emission scenarios (e.g., Representative Concentration Pathway (RCP)4.5 and RCP8.5 or equivalent). Cumulative carbon amounts are shown in Gigatons C (1 Gt C=1 billion metric tonnes), with source (negative values) indicating net carbon movement from soil to the atmosphere and sink (positive values) indicating the reverse. Some data-constrained models differentiated CO2 and CH4; bars show total carbon by weight, paired bars with * indicate CO2-equivalent, which takes into account the global warming potential of CH4. Ensemble mean bars refer to the model average for the Permafrost Carbon Model Intercomparison Project [5 models]. Bars that do not start at zero are in part informed by expert assessment and are shown as ranges; all other bars represent model mean estimates. Data are from 1 (Schuur et al., 2013); 2 (Schaefer et al., 2014) [8 models]; 3 (Schuur et al., 2015); 4 (Koven et al., 2015; Schneider von Deimling et al., 2015; Walter Anthony et al., 2018); 5 (MacDougall and Knutti, 2016; Burke et al., 2017a; Kleinen and Brovkin, 2018); 6 (McGuire et al., 2018).