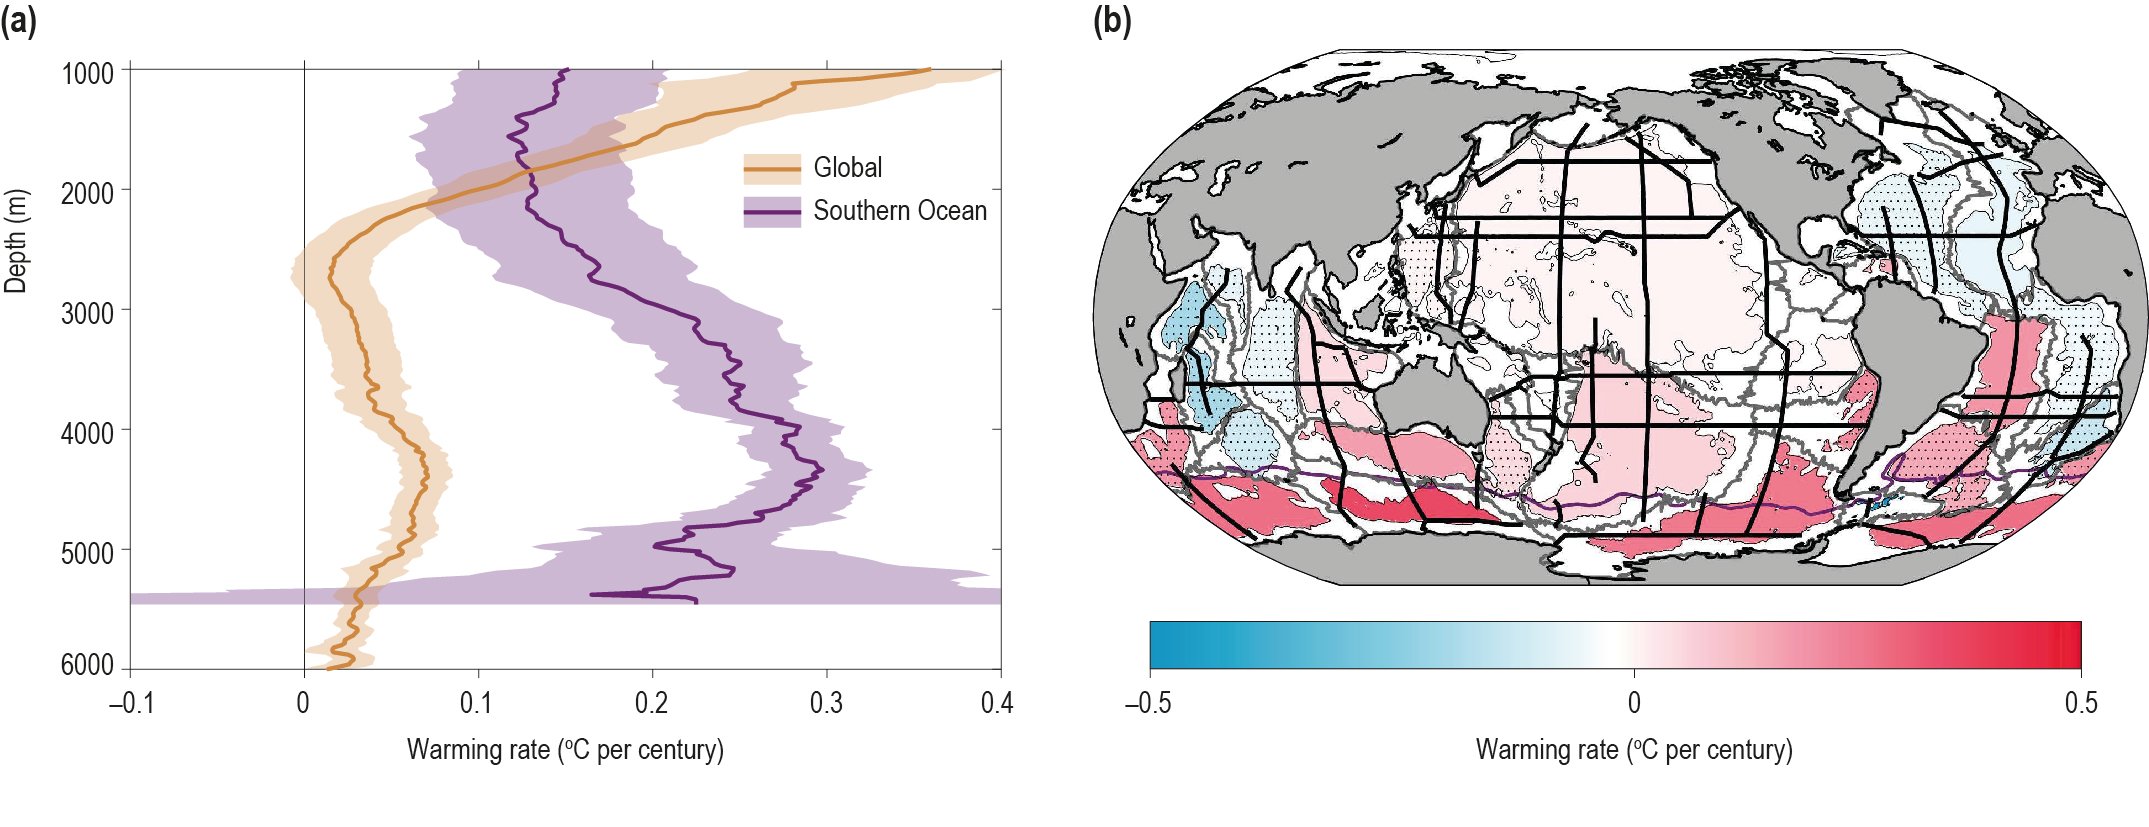
Figure 5.4 | Observed rates of warming from 1981 to 2019 (a) as a function of depth globally (orange) and south of the Sub-Antarctic Front (the purple line in (b) at about 55°S) (purple) with 90% confidence intervals and (b) average warming rate (colours) in the abyss (below 4000 m) over various ocean basins (whose boundaries are shown in grey lines), with stippling indicating basins with no significant changes. The black lines show the repeat hydrographic sections used to make these estimates. These figures use updated GoShip data and the techniques of Purkey and Johnson (2010).