Figure 6.9
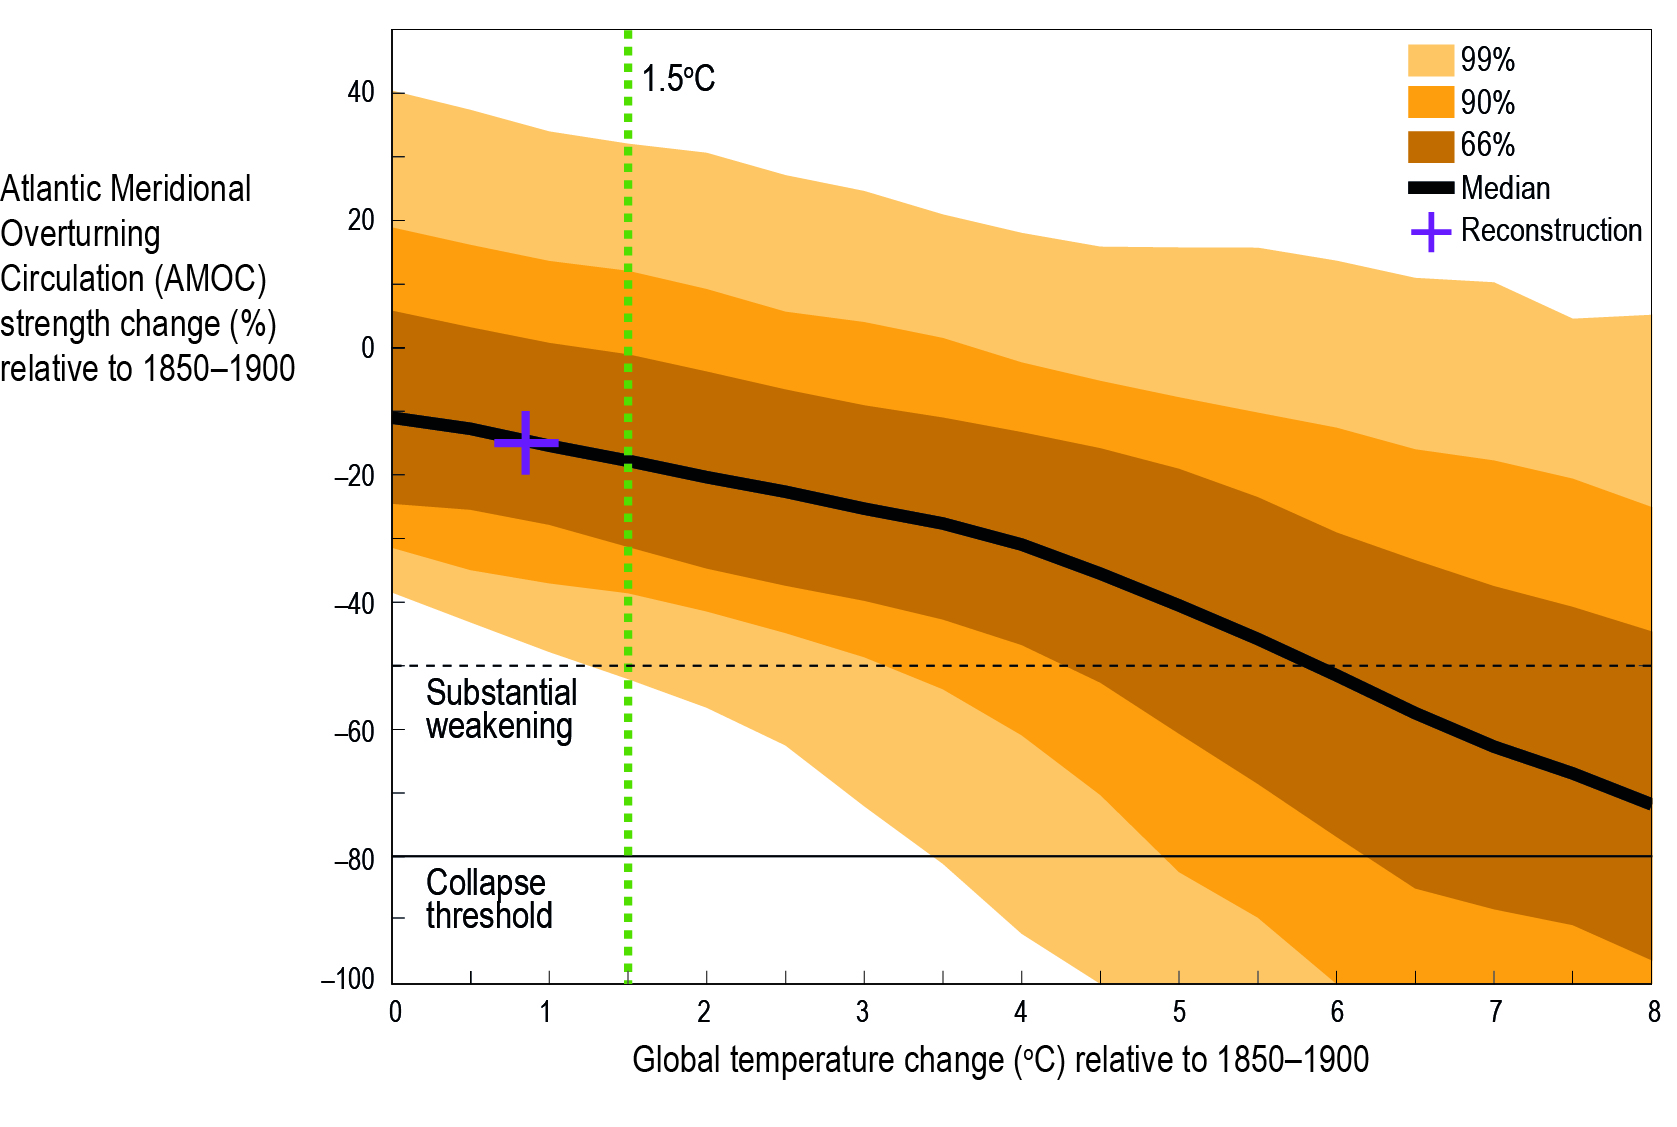
Figure 6.9 | The changes in the Atlantic Meridional Overturning Circulation (AMOC) strength as a function of transient changes in global mean temperature for projections from RCP4.5 and RCP8.5 scenario. This probabilistic assessment of annual mean AMOC strength changes (%) at 26oN (below 500 m and relative to 1850–1900) as a function of global temperature change (degrees Celsius; relative to 1850–1900) results from 10,000 RCP4.5 and 10,000 RCP8.5 experiments over the period 2006–2300, which are derived from an AMOC emulator calibrated with simulations from eight climate models including the Greenland Ice Sheet (GIS) melting (Bakker et al. 2016). The annual mean AMOC strength changes are taken from transient simulations and are therefore not equilibrium values per se. Moreover, it should be stressed that the results stem from future runs, not past or historical runs. Thus, due to internal variability both in the global mean temperature and AMOC in this transient simulation, large weakening can be found even at 0oC global warming. The ranges (66%, 90% and 99%) correspond to the amount of simulations that are within each envelope. The thick black line corresponds to the ensemble mean, while the different colours stand for different probability quantiles. The horizontal black thick line corresponds to the value of 80% of AMOC decrease, which can be seen as an almost total collapse of the AMOC. The horizontal black dashed thick line corresponds to a reduction of 50% of the AMOC, which can be considered as a substantial weakening. The vertical dashed green line stands for the 1.5oC of global warming threshold (relative to 1850–1900). The violet cross stands for the observation-based reduction estimate from Caesar et al. (2018). The size of the cross represents the uncertainty in this estimate.