Figure 6.5
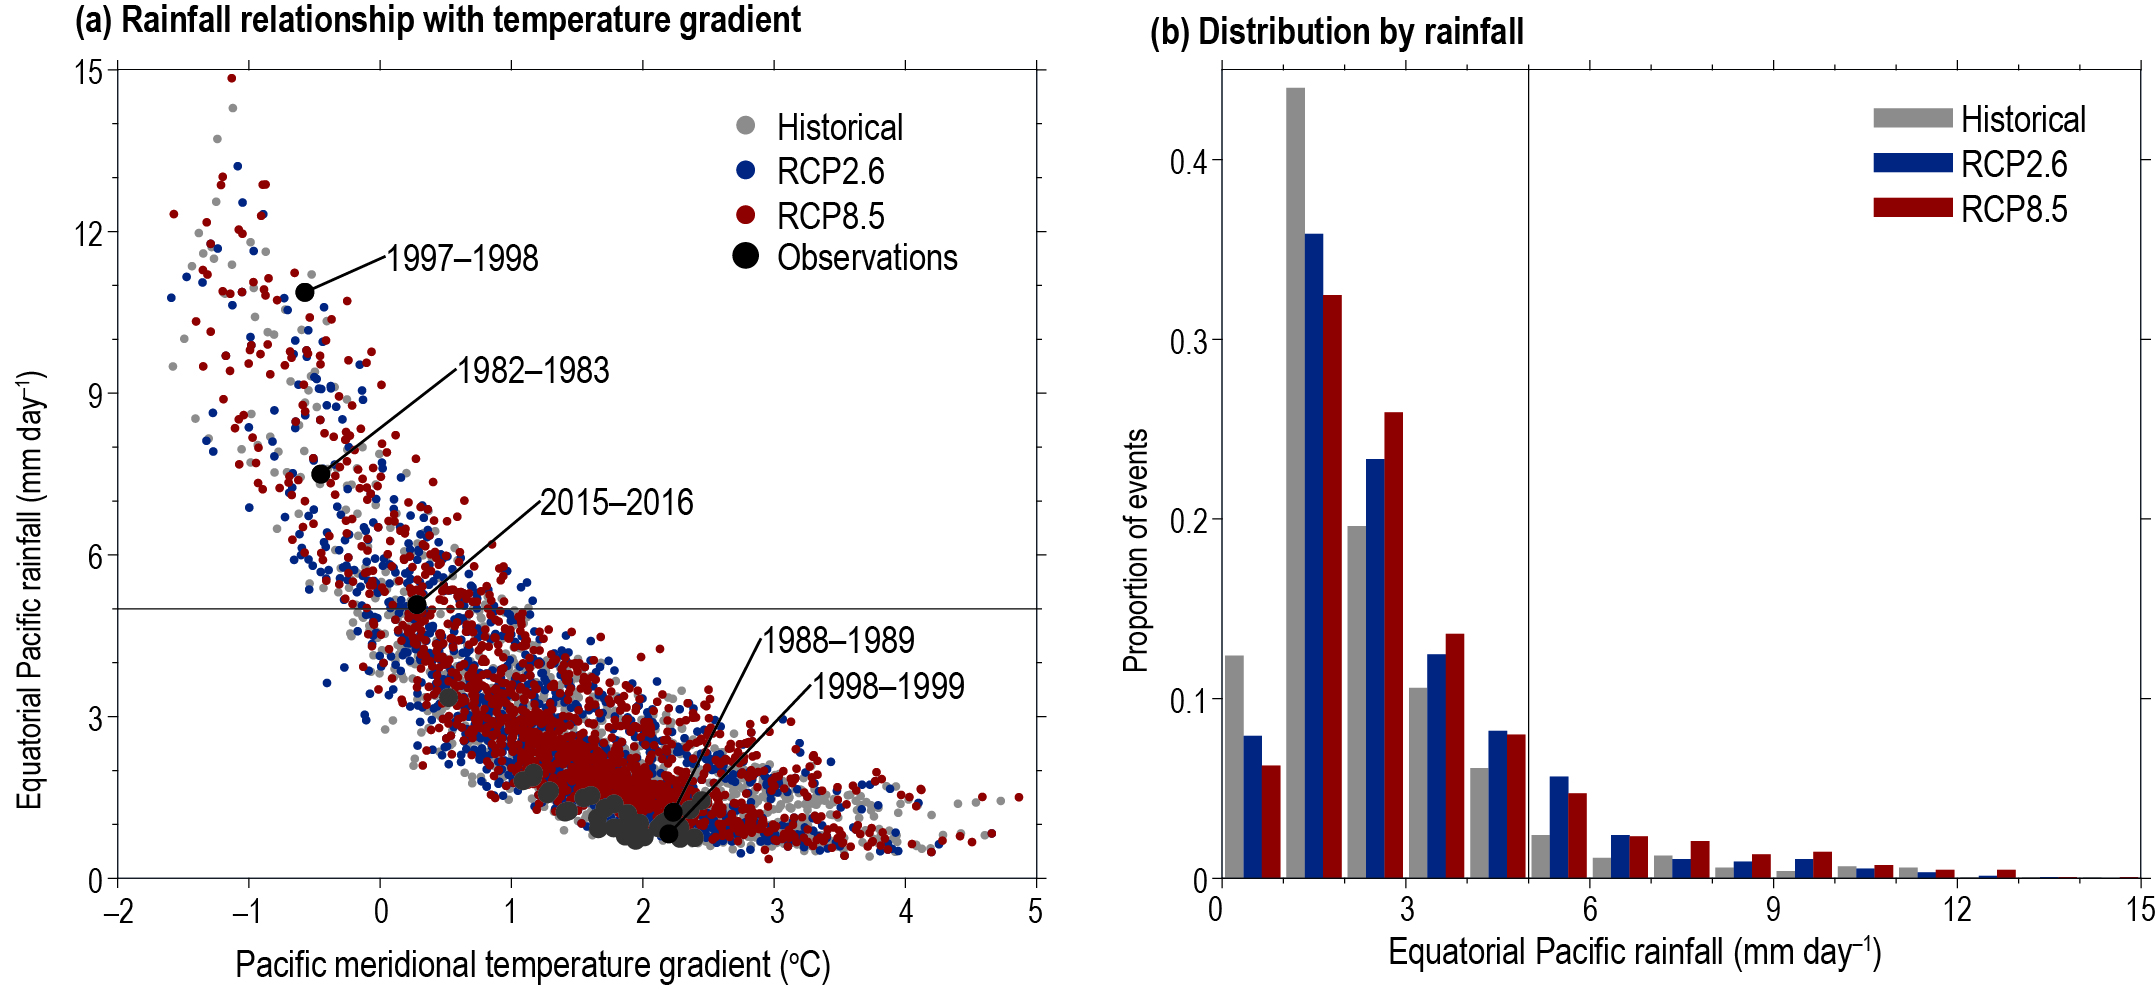
Figure 6.5 | Frequency of extreme El Niño Southern Oscillation (ENSO) events, adapted from Cai et al. (2014a). (a) December to February mean meridional sea surface temperature (SST) gradient (x-axis: 5oN–10oN, 210oE–270oE minus 2.5oS–2.5oN, 210oE–270oE) versus equatorial Pacific anomalous rainfall (y-axis: 5oS–5oN, 210oE–270oE). Data from only those Coupled Model Intercomparison Project Phase 5 (CMIP5) models that capture the observed relationship between Pacific SST and rainfall are shown. Black dots are from observations with extreme El Niño and extreme La Niña years indicated. The horizontal line denotes the threshold of 5 mm day–1 for an extreme event. (b)Histogram showing the relative frequency of rainfall rates. The vertical line denotes the 5 mm day–1 threshold. Higher counts of extreme events under the Representative Concentration Pathway (RCP)8.5 scenario suggest an increase in the frequency of extreme El Niño under global warming.