Figure 6.4
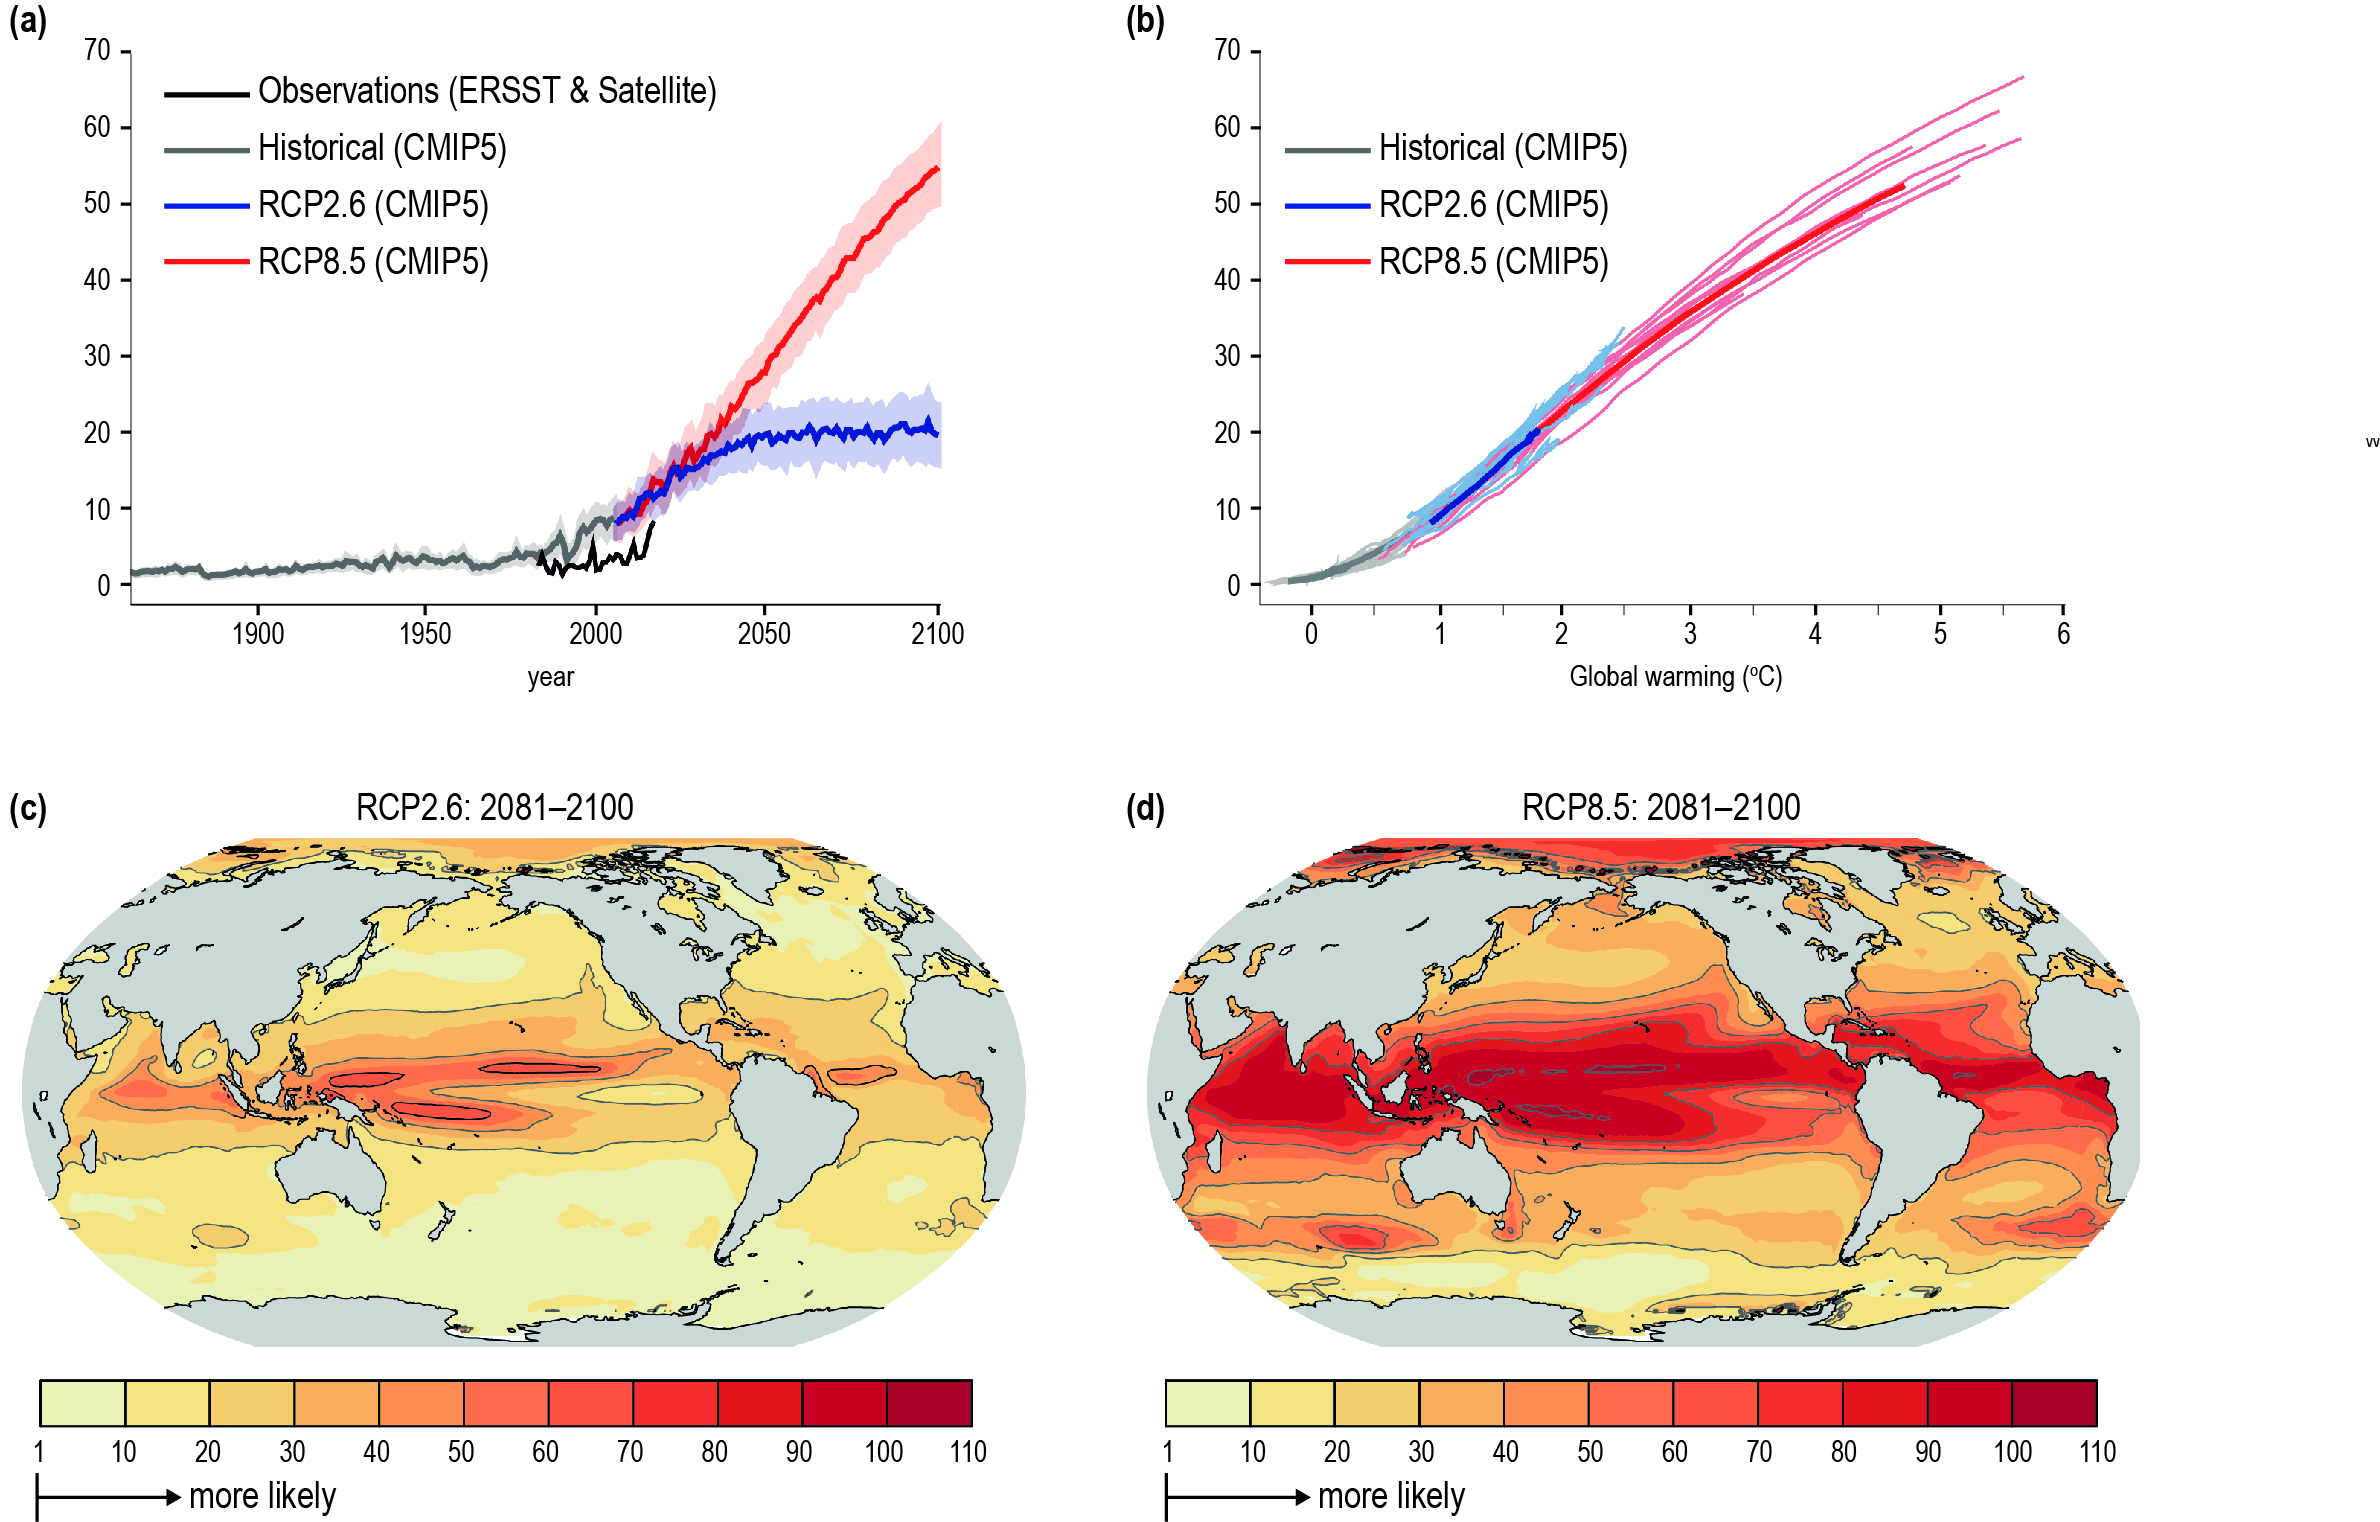
Figure 6.4 | Global and regional changes in the probability ratio of marine heatwaves (MHWs). The probability ratio is the fraction by which the number of MHW days yr–1 has changed since 1850–1900. (a) Changes in the annual mean probability ratio of MHWs exceeding the 99th percentile of pre-industrial local daily sea surface temperature (SST) averaged over the ocean. The thick lines represent the multi-model averages of 12 climate models that participated in the Coupled Model Intercomparison Project Phase 5 (CMIP5) covering the 1861–2100 period for the Representative Concentration Pathway (RCP) 8.5 and RCP2.6 scenarios, respectively. The shaded bands indicate the 90% confidence interval of the standard error of the mean. The black line shows an observational-based estimate. As daily SST data are available only for the 1982–2016 period, we assume that the observed mean temperature change is the main cause of the change in frequency of extremes (Frölicher et al. 2018; Oliver, 2019). We therefore subtracted first the differences between 1854–1900 and 1982–2016 obtained from the extended reconstructed SST Version 4 dataset (ERSSTv4; Huang et al. 2015a) from the daily satellite data before calculating the 99th percentile for the observations. (b) Same as (a), but the probability ratio is plotted for different levels of global surface atmospheric warming and for the individual models. The simulated time series in (b) are smoothed with a 10-year running mean. (c,d) Simulated regional changes in the multi-model mean probability ratio of MHWs exceeding the preindustrial 99th percentile in 2081–2100 for the (c) RCP2.6 scenario and the (d) RCP8.5 scenario. The grey contours in (c,d) highlight the spatial pattern. Figure is modified from Frölicher et al. (2018).