Figure 6.3
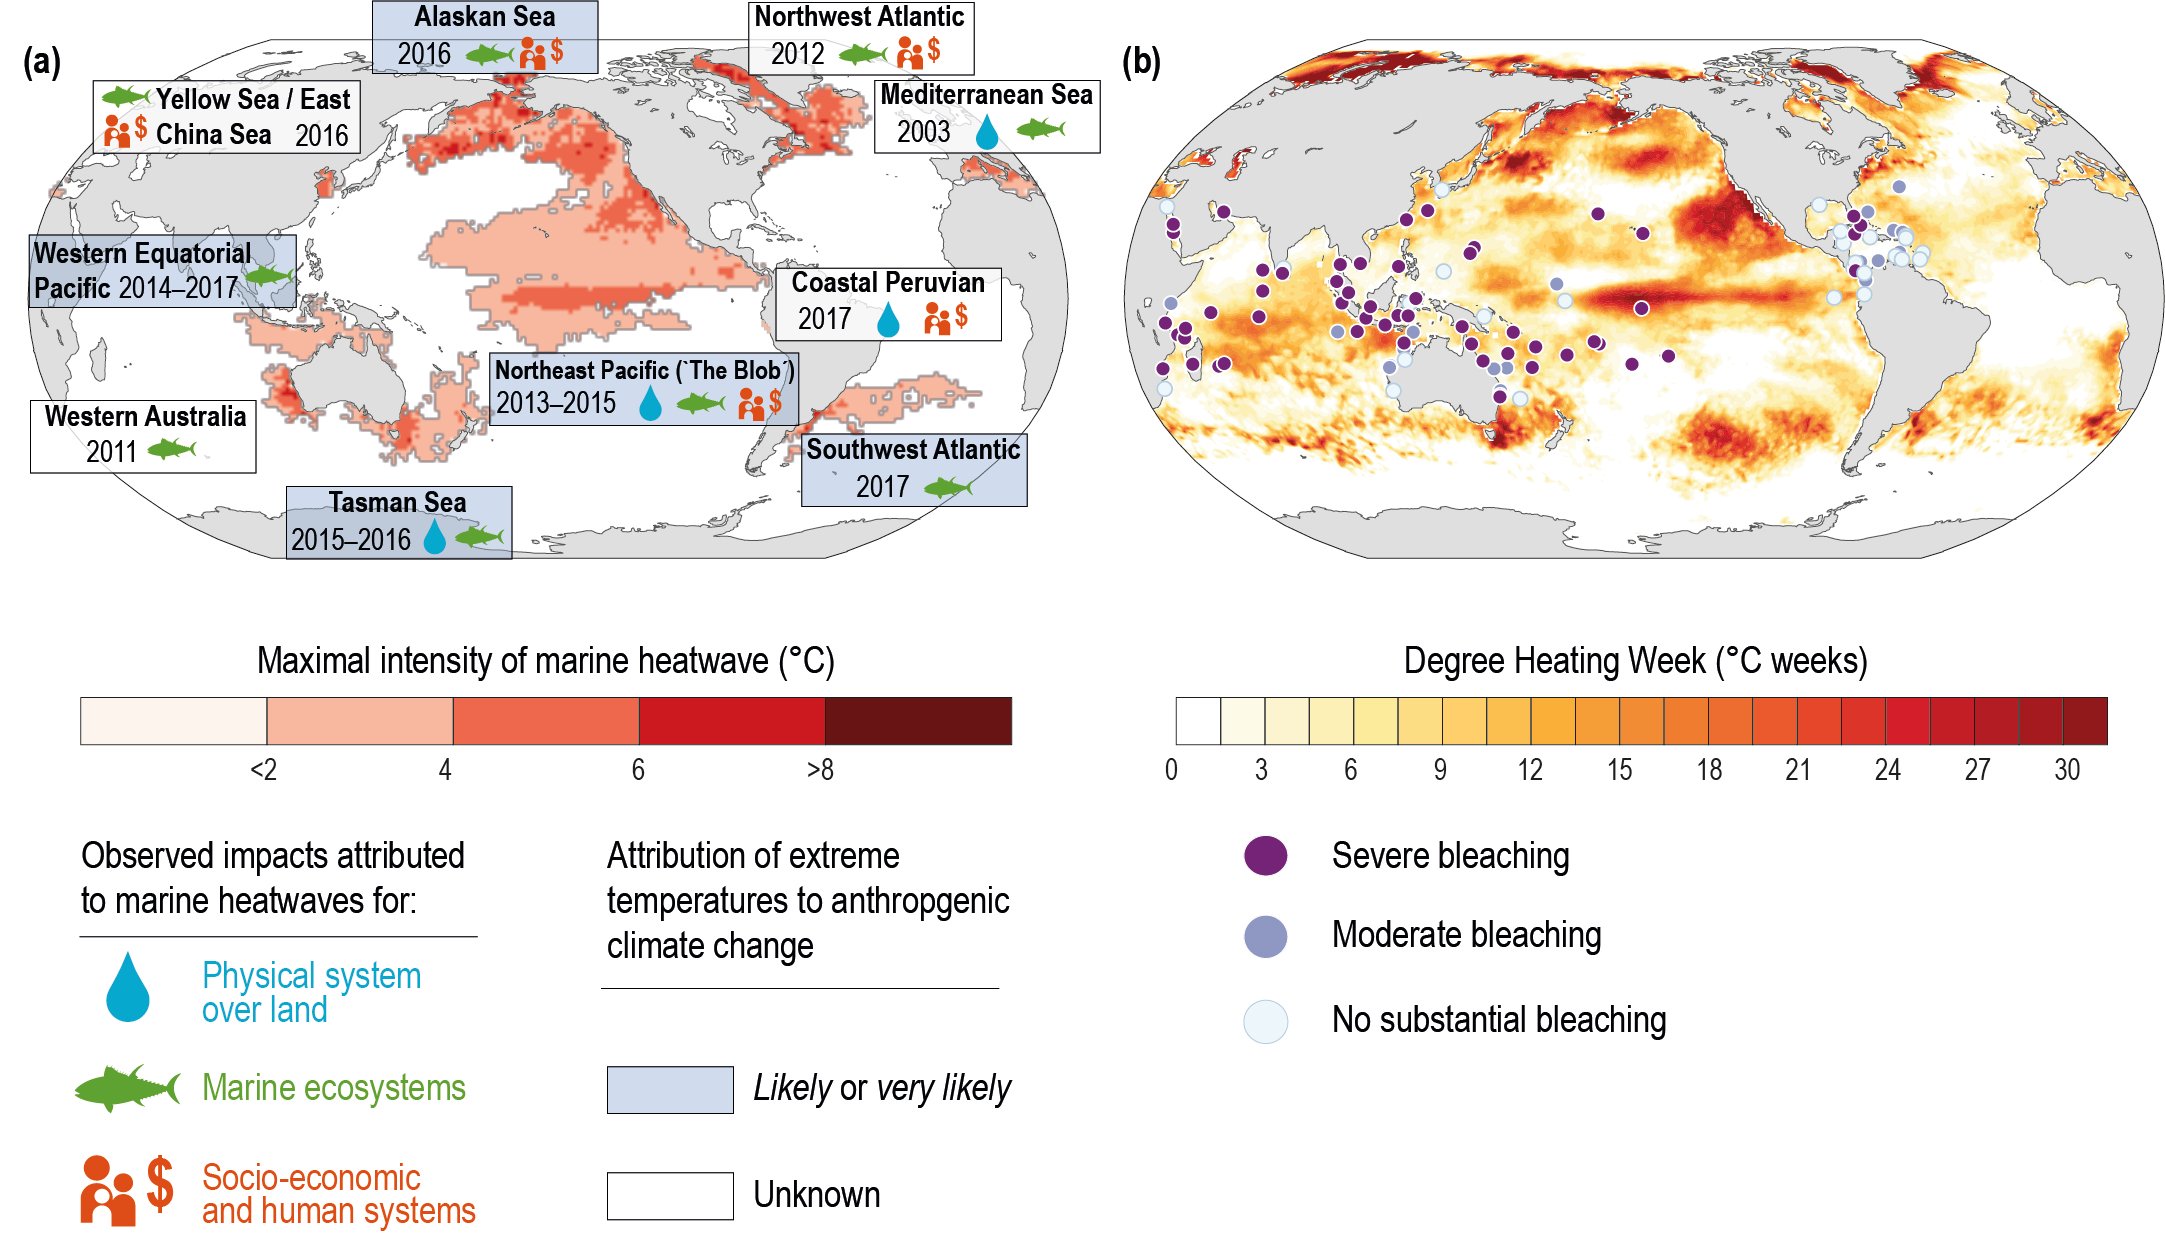
Figure 6.3 | Examples of recent marine heatwaves (MHWs) and their observed impacts. (a) Examples of documented MHWs over the last two decades and their impacts on natural, physical and socioeconomic systems. The colour map shows the maximum sea surface temperature (SST) anomaly during the MHW using the National Oceanic and Atmospheric Administration’s (NOAA) daily Optimum Interpolation SST dataset (Reynolds et al. 2007; Banzon et al. 2016). A MHW is defined here as a set of spatially and temporally coherent grid points exceeding the 99th percentile. The 99th percentile is calculated over the 1982–2011 reference period after de-seasonalising the data. Red shading of the boxes indicates if the likelihood of MHW occurrence has increased due to anthropogenic climate change, and symbols denote observed impacts on physical systems over land, marine ecosystems, and socioeconomic and human systems. Figure is updated from Frölicher and Laufkötter (2018) and is not a complete compilation of all documented MHWs. (b) The record warming years 2015 and 2016 and the global extent of mass bleaching of corals during these years. The colour map shows the Degree Heating Week (DHW) annual maximum over 2015 and 2016 from NOAA’s Coral Reef Watch Daily Global 5 km Satellite Coral Bleaching Heat Stress Monitoring Product Suite v.3.1 (Liu et al. 2014a). The DHW describes how much heat has accumulated in an area over the past twelve weeks by adding up any temperatures that exceed 1oC above the maximum summertime mean (e.g., Eakin et al. 2010). Symbols show reef locations that are assessed in Hughes et al. (2018a) and indicate where severe bleaching affected more than 30% of corals (purple circles), moderate bleaching affected less than 30% of corals (blue circles), and no substantial bleaching was recorded (light blue circles).