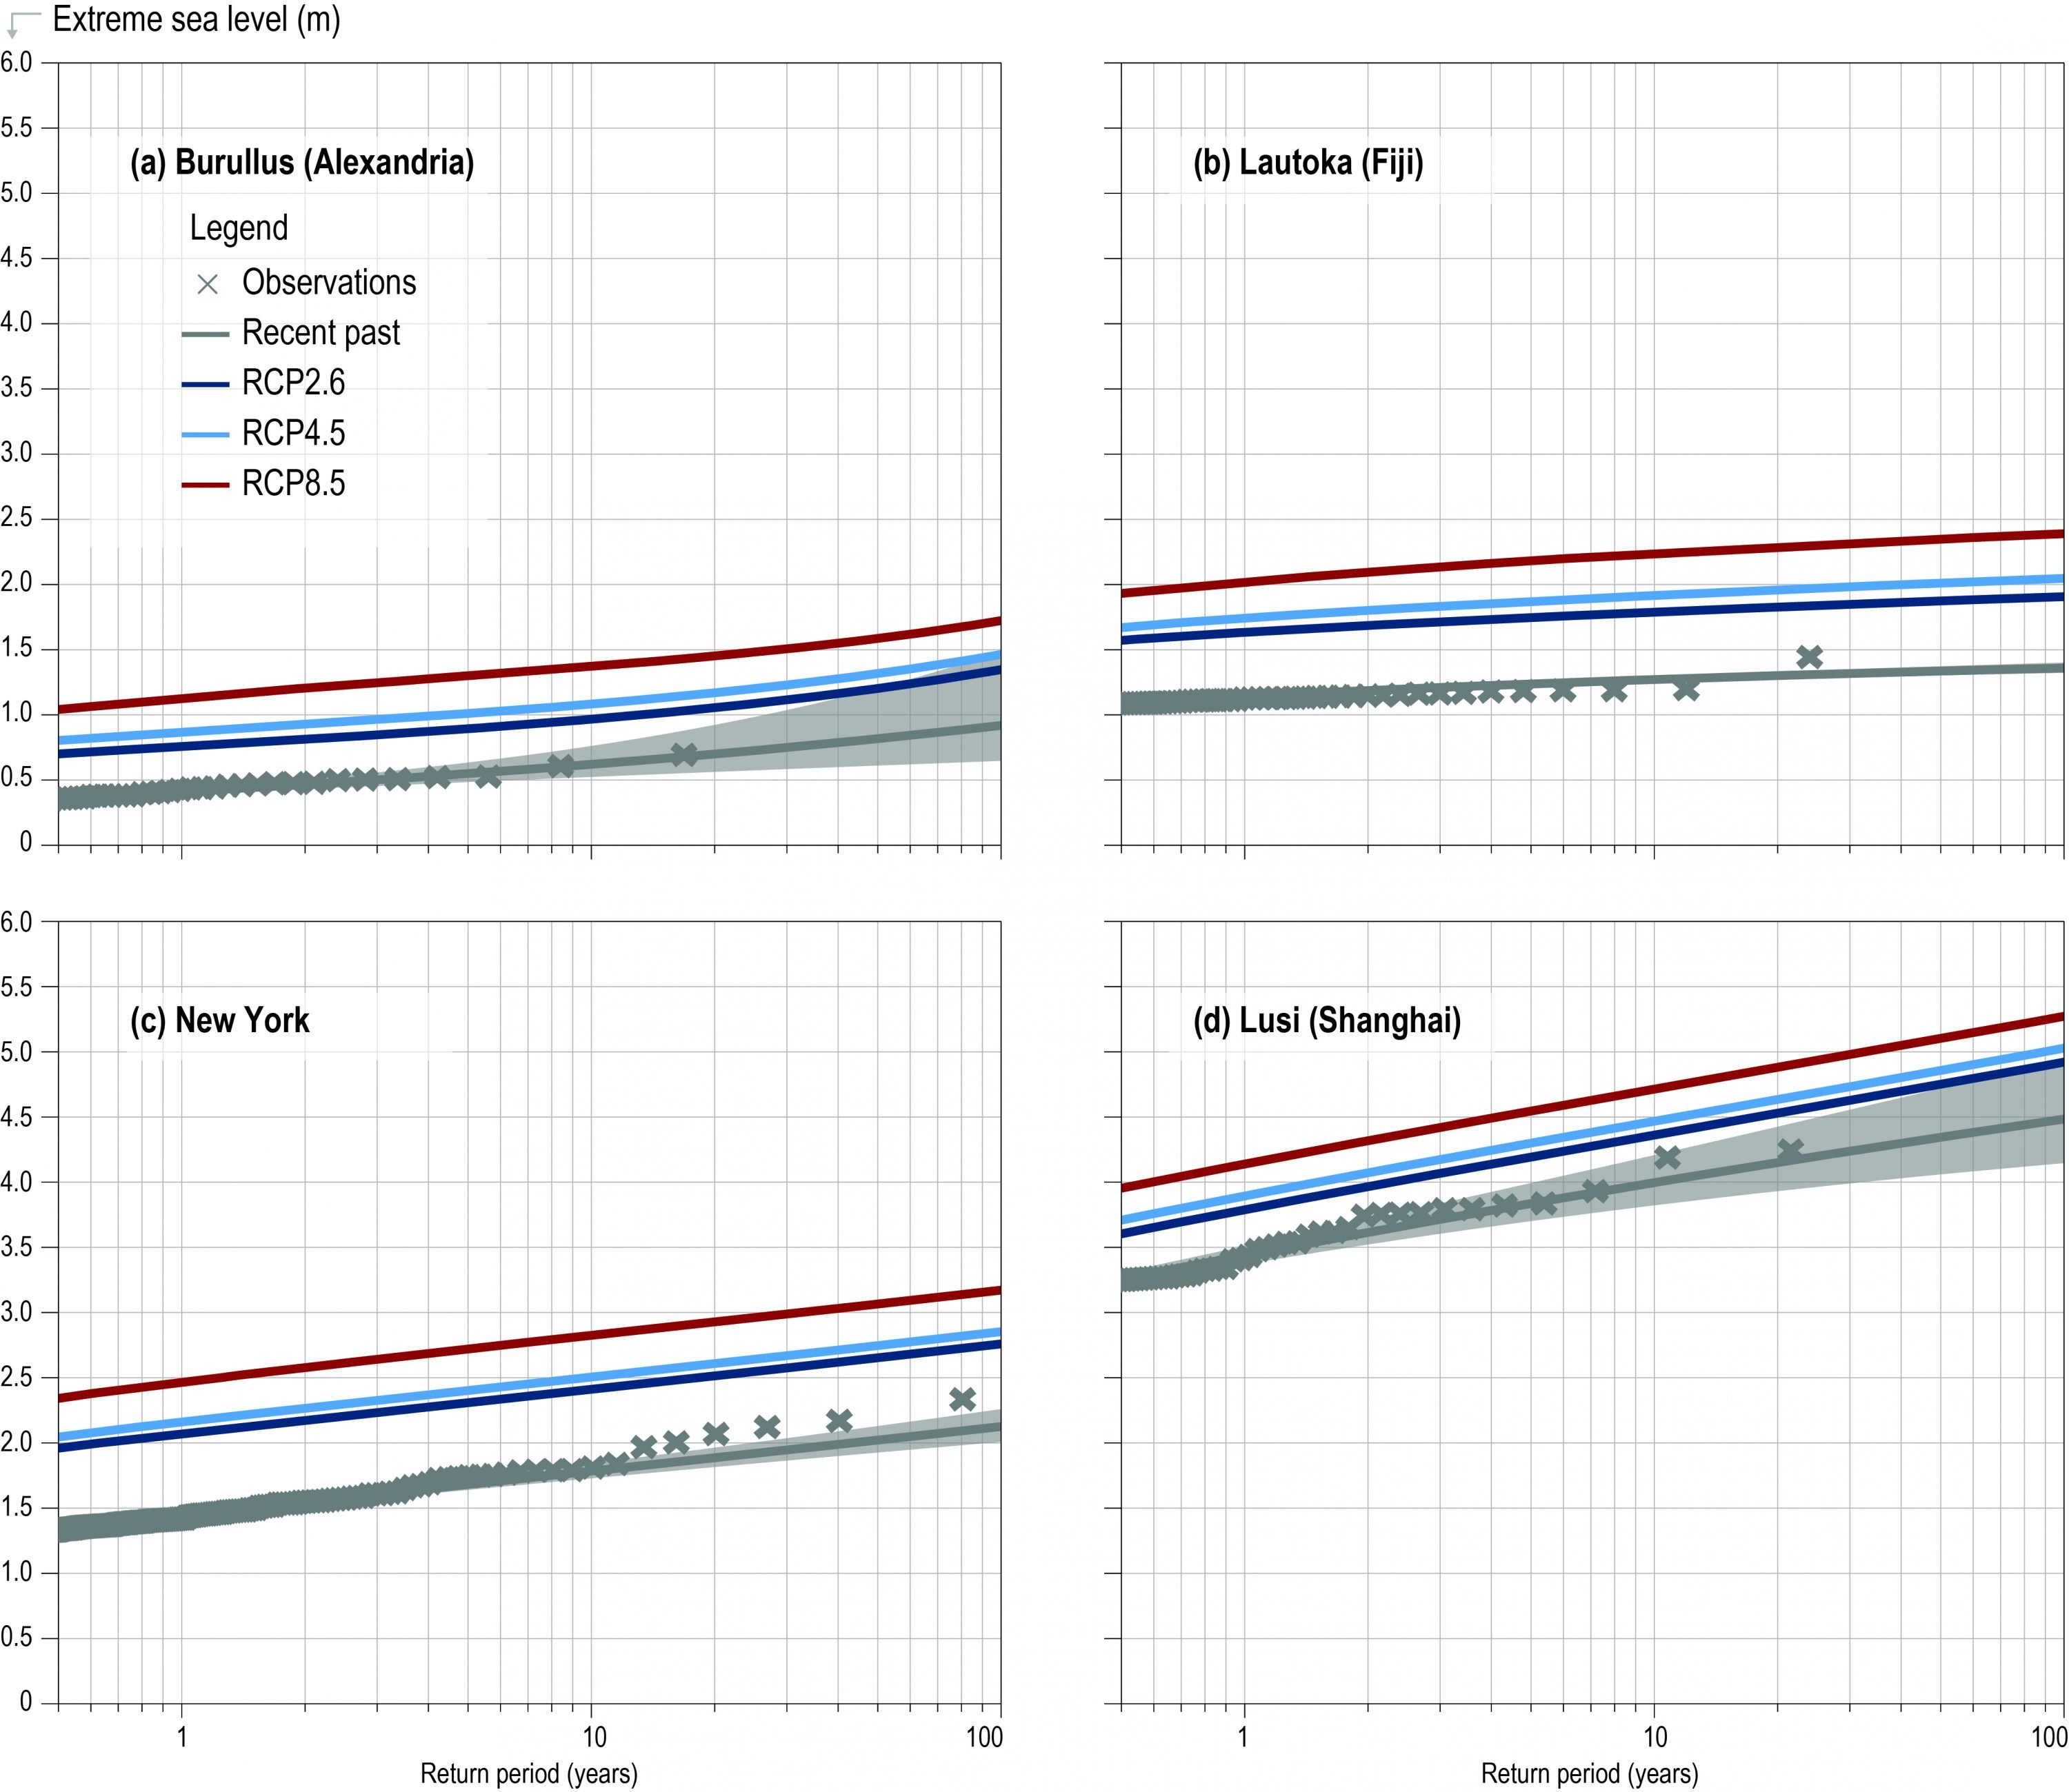
Box 4.1, Figure 1
Box 4.1, Figure 1 | Historical and projected extreme sea level (ESL) events at four stations discussed in this box. The heights of ESL events are shown as a function of their return period. Observations (crosses) are derived from tide-gauge records. The historical return height (grey) is the best fit through these observations, and the 5–95% confidence intervals (grey band) are shown. Note that the confidence interval for Lautoka is too narrow to be visible. Future ESL events represent the effect of regional sea level change for the period 2081–2100 for scenarios RCP2.6 (blue) and RCP8.5 (red). The increased height of the 100-year event for scenario RCP2.6 and RCP8.5 is 0.43 m and 0.80 m respectively for Burullus; 0.55 m and 1.03 m for Lautoka; 0.63 m and 1.04 m for New York; and 0.44 m and 0.79 m for Lusi. The increased frequency of the historical 100-year event for scenario RCP2.6 and RCP8.5 is a factor of 15 and 777 for Burullus; >1200 and >1200 for Lautoka; 67 and 541 for New York; and 6 and 26 for Lusi. The notation >1200 indicates that the methodology allows for estimation of only a lower bound on the increased frequency.