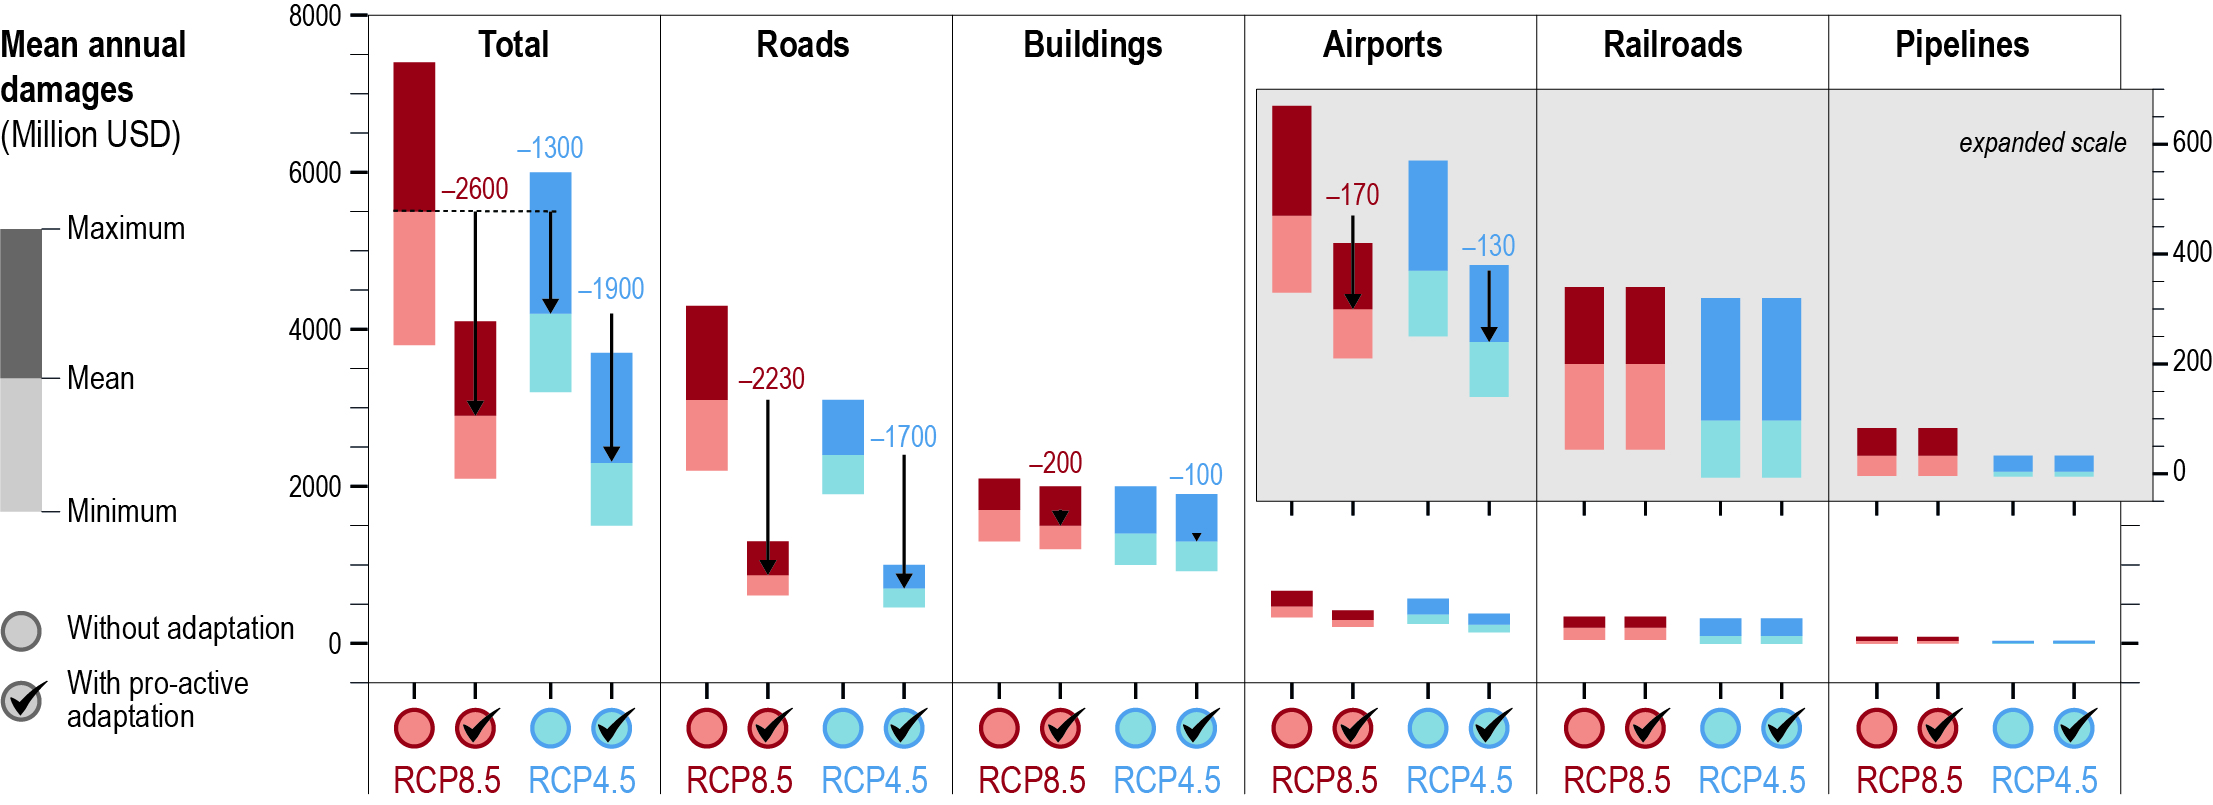
Changes in public infrastructure damage costs in cumulative USD by 2100 in Alaska under different emission scenarios (Representative Concentration Pathways (RCP)). The inset showing airports, railroads, and pipelines has a different in scale than roads, buildings, and the total. Bars over open circles represent climate-related costs of impact with no engineering adaptation measures, whereas bars over check-marked circles represent the costs following savings from engineering adaptation (figure modified from Melvin et al., 2017).