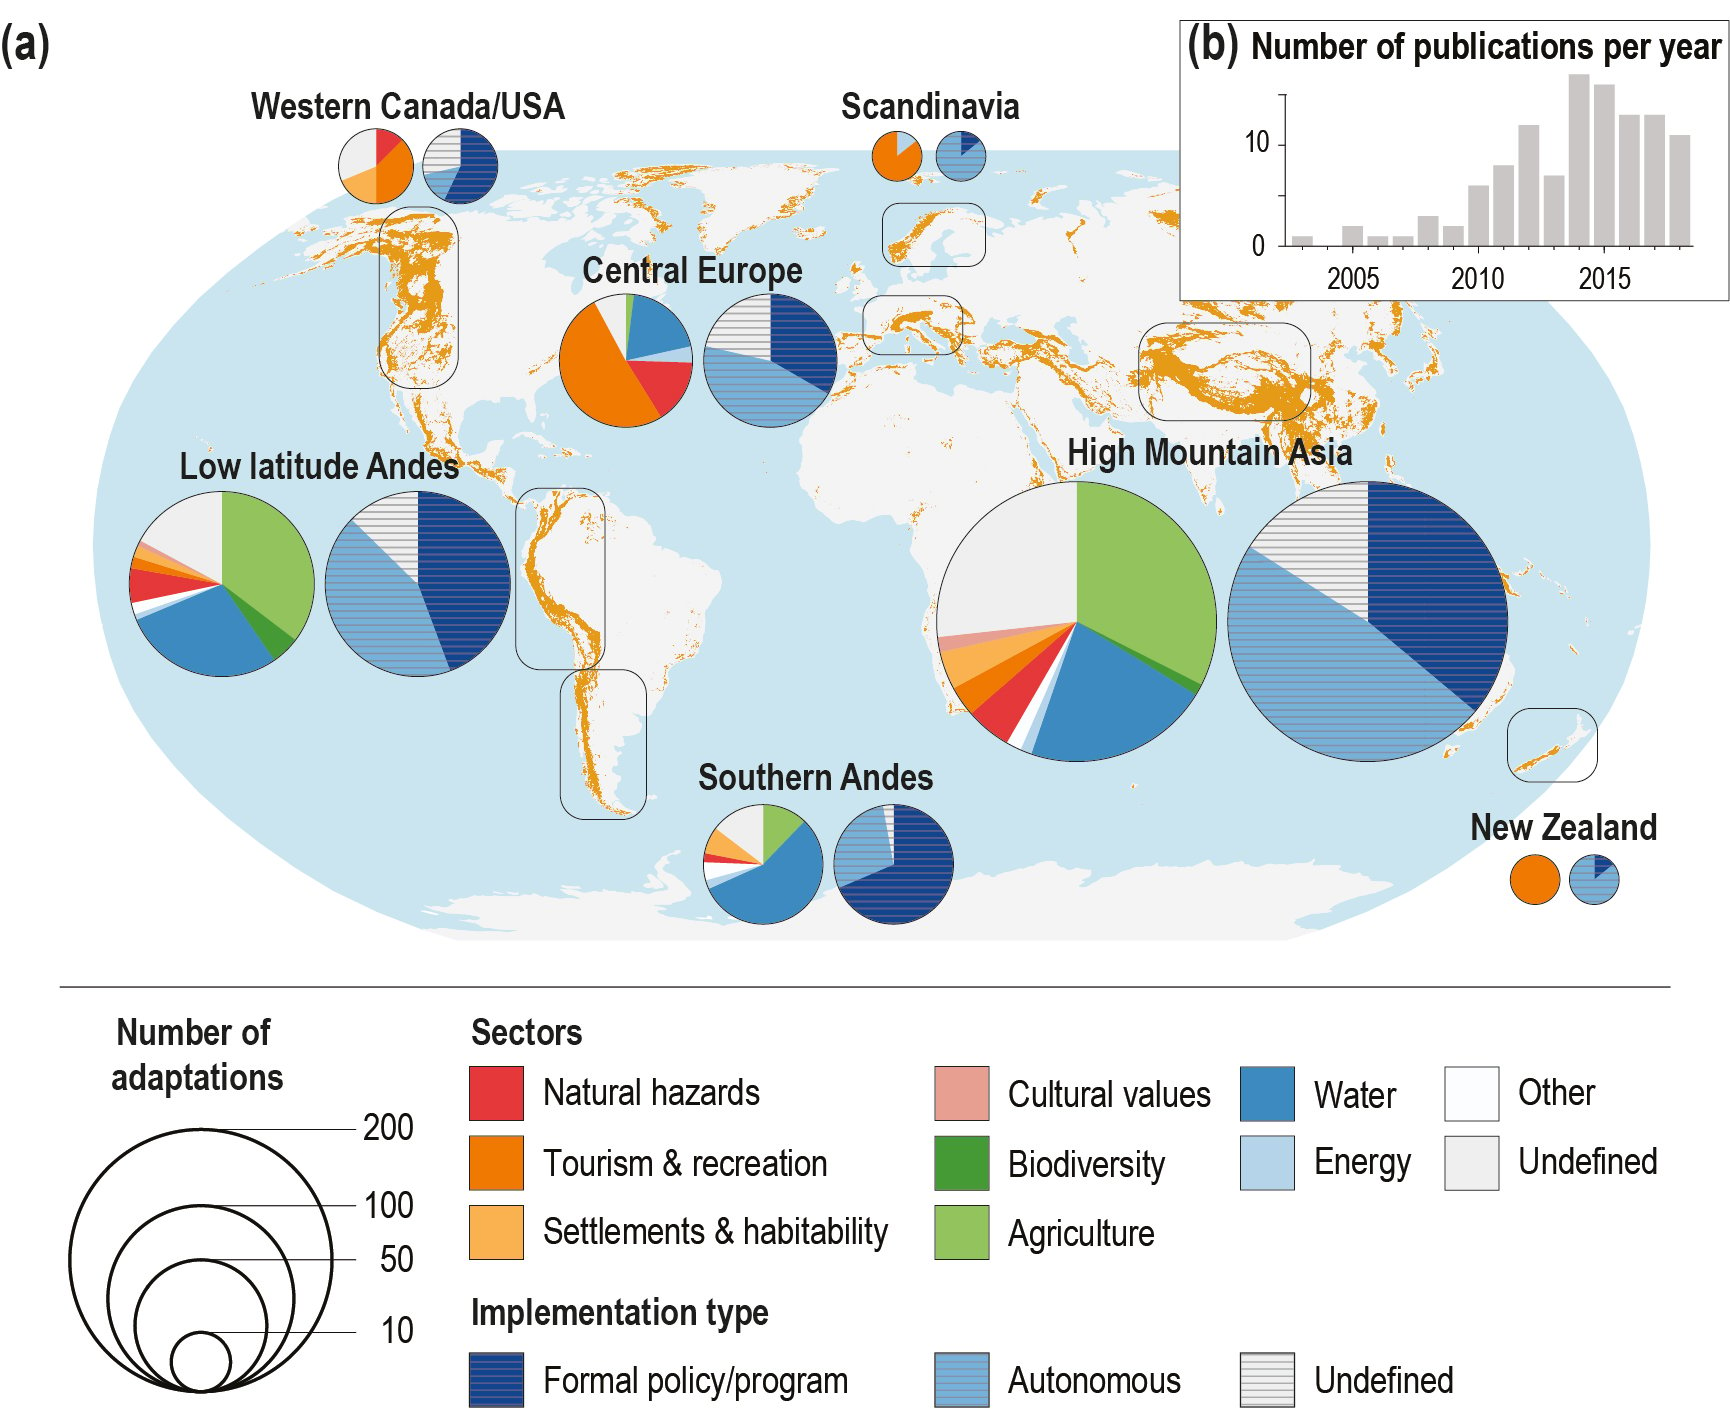
Figure 2.9 | a) Documented number of individual adaptation actions distributed across seven of the high mountain regions addressed in this Chapter, with pie charts indicating the number of adaptation measures for sectors addressed in this chapter (left pie chart), and the relative proportion of these classified as either ‘formal’, ‘autonomous’ or ‘undefined’ (right pie chart). Note that for regions with less than five reported adaptation measures were excluded from the figure (i.e., Caucasus, Iceland and Alaska), however these are detailed in Table SM2.9. b) Number of publications reported in the assessed literature over time. In some cases, multiple adaptation measures are discussed in a single publication (Table SM2.9).