ES
Executive Summary
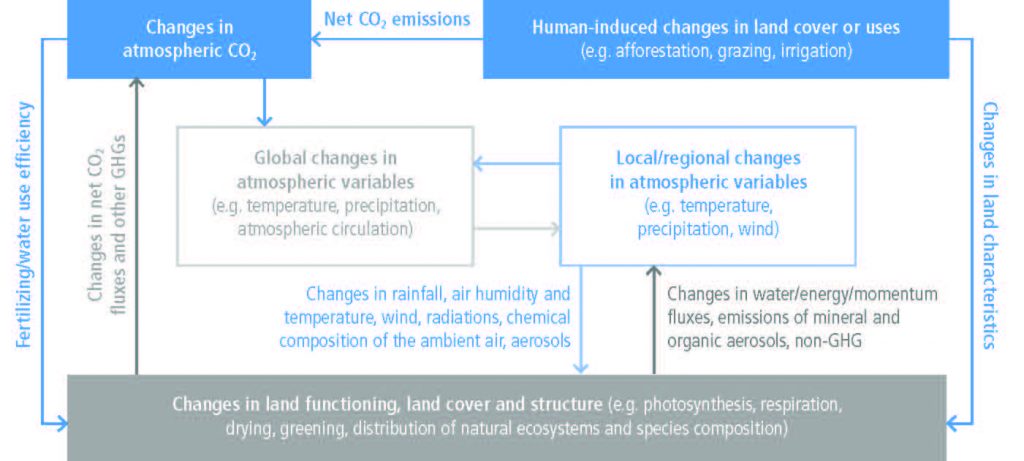
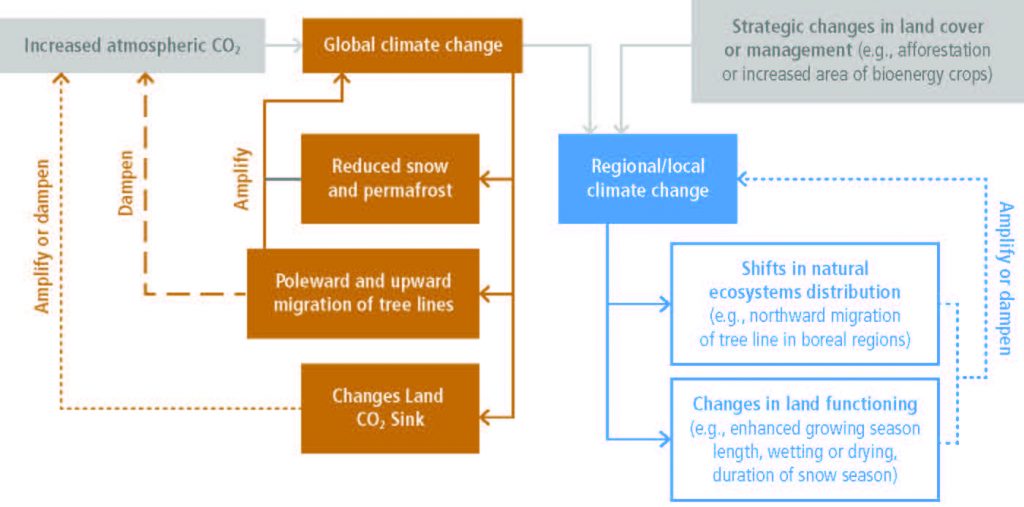
Land and climate interact in complex ways through changes in forcing and multiple biophysical and biogeochemical feedbacks across different spatial and temporal scales. This chapter assesses climate impacts on land and land impacts on climate, the human contributions to these changes, as well as land-based adaptation and mitigation response options to combat projected climate changes.
Implications of climate change, variability and extremes for land systems
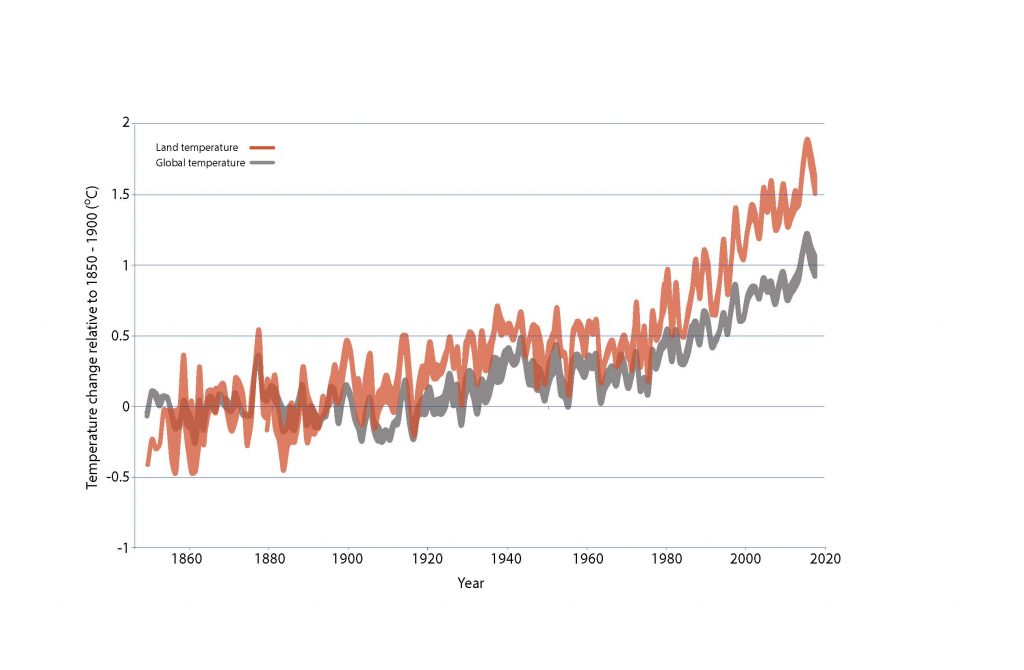
It is certain that globally averaged land surface air temperature (LSAT) has risen faster than the global mean surface temperature (i.e., combined LSAT and sea surface temperature) from the preindustrial period (1850–1900) to the present day (1999–2018). According to the single longest and most extensive dataset, from 1850–1900 to 2006–2015 mean land surface air temperature has increased by 1.53°C (very likely range from 1.38°C to 1.68°C) while global mean surface temperature has increased by 0.87°C (likely range from 0.75°C to 0.99°C). For the 1880–2018 period, when four independently produced datasets exist, the LSAT increase was 1.41°C (1.31–1.51°C), where the range represents the spread in the datasets’ median estimates. Analyses of paleo records, historical observations, model simulations and underlying physical principles are all in agreement that LSATs are increasing at a higher rate than SST as a result of differences in evaporation, land–climate feedbacks and changes in the aerosol forcing over land (very high confidence). For the 2000–2016 period, the land-to-ocean warming ratio (about 1.6) is in close agreement between different observational records and the CMIP5 climate model simulations (the likely range of 1.54–1.81). {2.2.1}
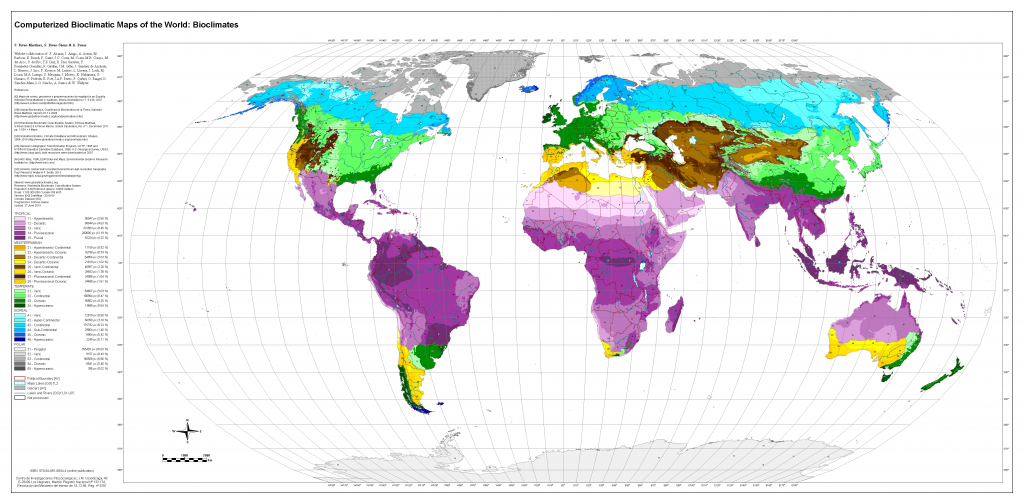
Anthropogenic warming has resulted in shifts of climate zones, primarily as an increase in dry climates and decrease of polar climates (high confidence). Ongoing warming is projected to result in new, hot climates in tropical regions and to shift climate zones poleward in the mid- to high latitudes and upward in regions of higher elevation (high confidence). Ecosystems in these regions will become increasingly exposed to temperature and rainfall extremes beyonwd the climate regimes they are currently adapted to (high confidence), which can alter their structure, composition and functioning. Additionally, high-latitude warming is projected to accelerate permafrost thawing and increase disturbance in boreal forests through abiotic (e.g., drought, fire) and biotic (e.g., pests, disease) agents (high confidence). {2.2.1, 2.2.2, 2.5.3}
Globally, greening trends (trends of increased photosynthetic activity in vegetation) have increased over the last 2–3 decades by 22–33%, particularly over China, India, many parts of Europe, central North America, southeast Brazil and southeast Australia (high confidence). This results from a combination of direct (i.e., land use and management, forest conservation and expansion) and indirect factors (i.e., CO2 fertilisation, extended growing season, global warming, nitrogen deposition, increase of diffuse radiation) linked to human activities (high confidence). Browning trends (trends of decreasing photosynthetic activity) are projected in many regions where increases in drought and heatwaves are projected in a warmer climate. There is low confidence in the projections of global greening and browning trends. {2.2.4, Cross- Chapter Box 4 in this chapter}
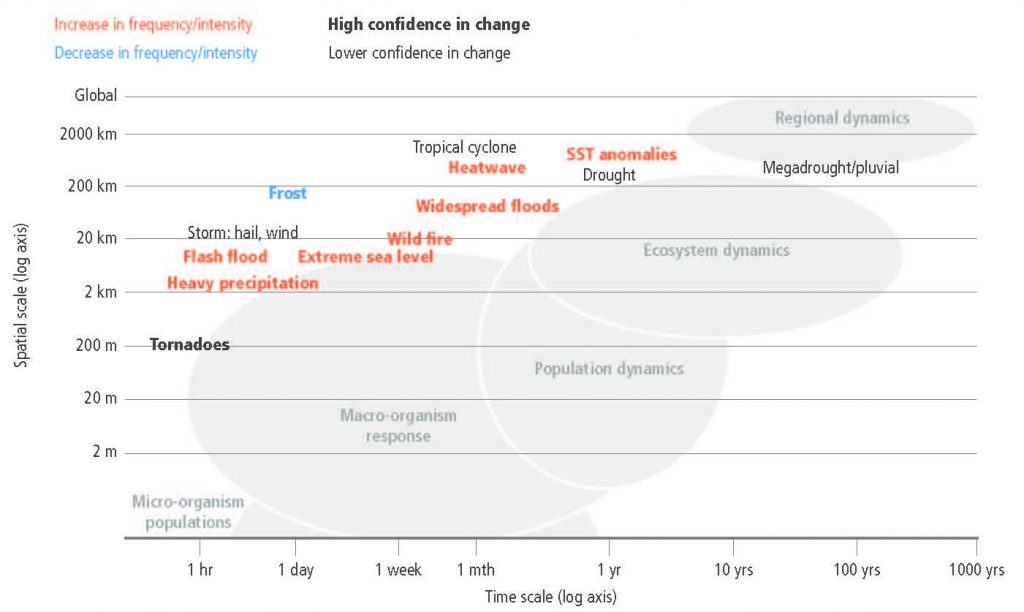
The frequency and intensity of some extreme weather and climate events have increased as a consequence of global warming and will continue to increase under medium and high emission scenarios (high confidence). Recent heat-related events, for example, heatwaves, have been made more frequent or intense due to anthropogenic greenhouse gas (GHG) emissions in most land regions and the frequency and intensity of drought has increased in Amazonia, north-eastern Brazil, the Mediterranean, Patagonia, most of Africa and north-eastern China (medium confidence). Heatwaves are projected to increase in frequency, intensity and duration in most parts of the world (high confidence) and drought frequency and intensity is projected to increase in some regions that are already drought prone, predominantly in the Mediterranean, central Europe, the southern Amazon and southern Africa (medium confidence). These changes will impact ecosystems, food security and land processes including GHG fluxes (high confidence). {2.2.5}
Climate change is playing an increasing role in determining wildfire regimes alongside human activity (medium confidence), with future climate variability expected to enhance the risk and severity of wildfires in many biomes such as tropical rainforests (high confidence). Fire weather seasons have lengthened globally between 1979 and 2013 (low confidence). Global land area burned has declined in recent decades, mainly due to less burning in grasslands and savannahs (high confidence). While drought remains the dominant driver of fire emissions, there has recently been increased fire activity in some tropical and temperate regions during normal to wetter than average years due to warmer temperatures that increase vegetation flammability (medium confidence). The boreal zone is also experiencing larger and more frequent fires, and this may increase under a warmer climate (medium confidence). {Cross-Chapter Box 4 in this chapter}
Terrestrial greenhouse gas fluxes on unmanaged and managed lands
Agriculture, forestry and other land use (AFOLU) is a significant net source of GHG emissions (high confidence), contributing to about 23% of anthropogenic emissions of carbon dioxide (CO2), methane (CH4) and nitrous oxide (N2O) combined as CO2 equivalents in 2007–2016 (medium confidence). AFOLU results in both emissions and removals of CO2, CH4 and N2O to and from the atmosphere (high confidence). These fluxes are affected simultaneously by natural and human drivers, making it difficult to separate natural from anthropogenic fluxes (very high confidence). {2.3}
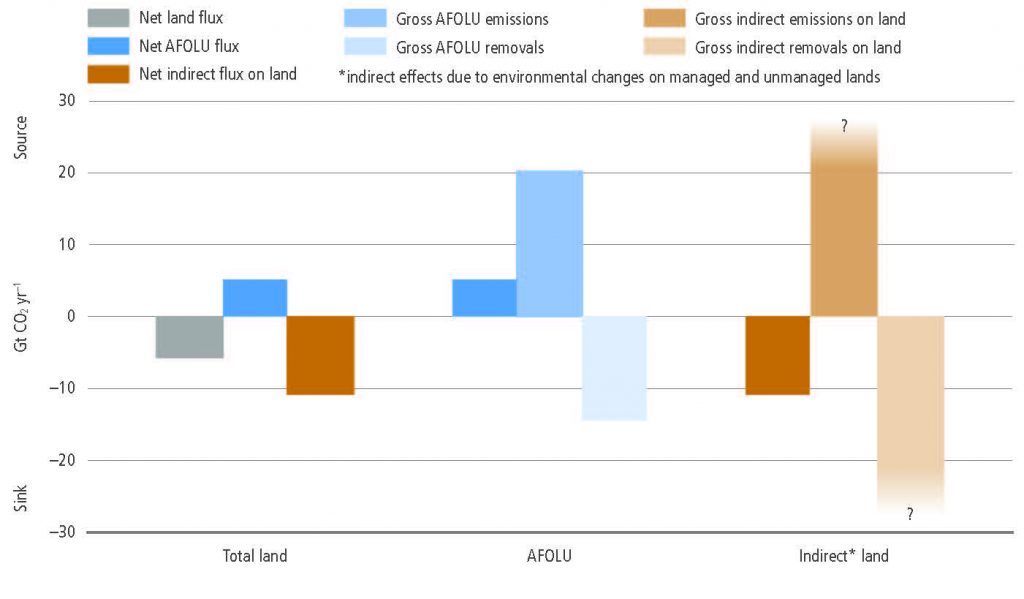
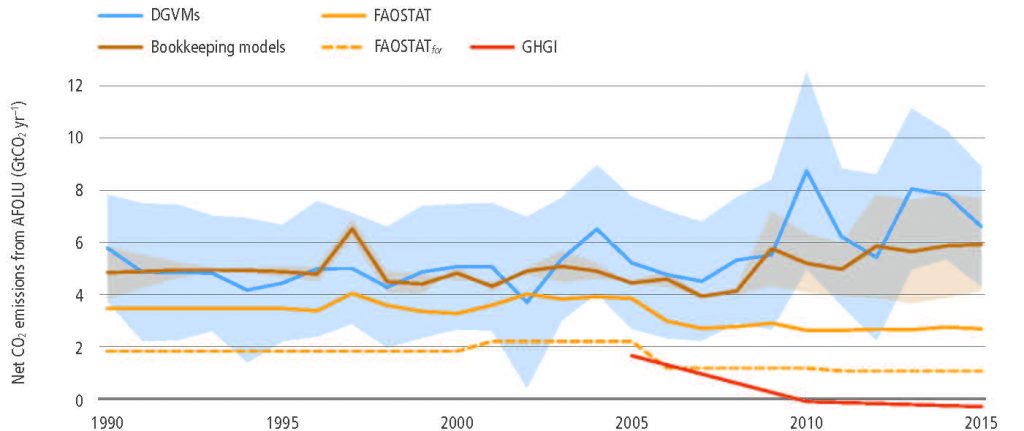
The total net land-atmosphere flux of CO2 on both managed and unmanaged lands very likely provided a global net removal from 2007 to 2016 according to models (-6.0 ± 3.7 CO2 yr–1, likely range). This net removal is comprised of two major components: (i) modelled net anthropogenic emissions from AFOLU are 5.2 ± 2.6 GtCO2 yr–1 (likely range) driven by land cover change, including deforestation and afforestation/reforestation, and wood harvesting (accounting for about 13% of total net anthropogenic emissions of CO2) (medium confidence), and (ii) modelled net removals due to non-anthropogenic processes are 11.2 ± 2.6 GtCO2 yr–1 (likely range) on managed and unmanaged lands, driven by environmental changes such as increasing CO2, nitrogen deposition and changes in climate (accounting for a removal of 29% of the CO2 emitted from all anthropogenic activities (fossil fuel, industry and AFOLU) (medium confidence). {2.3.1}
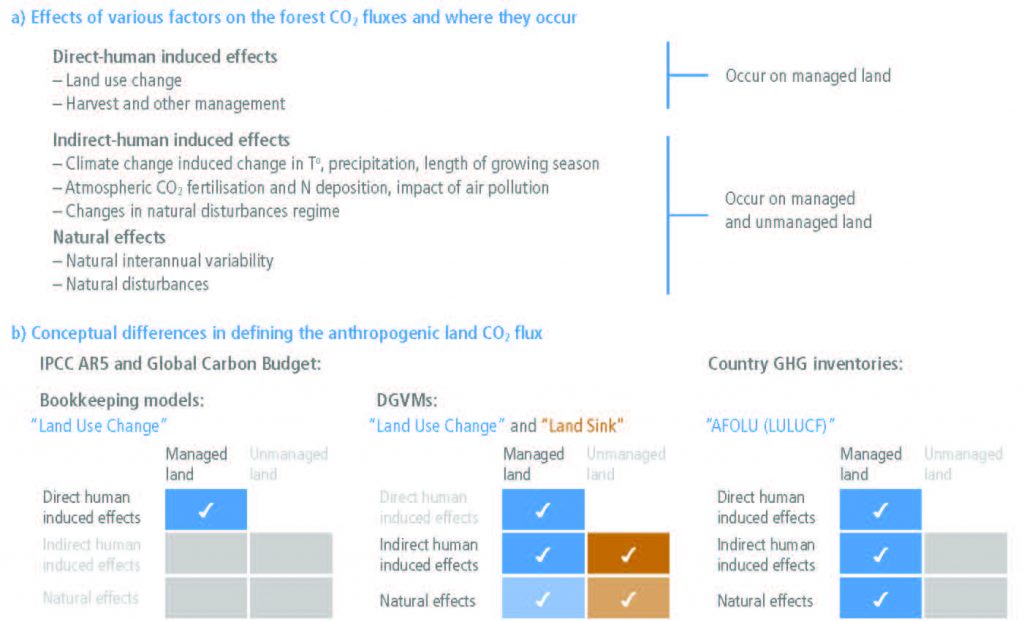
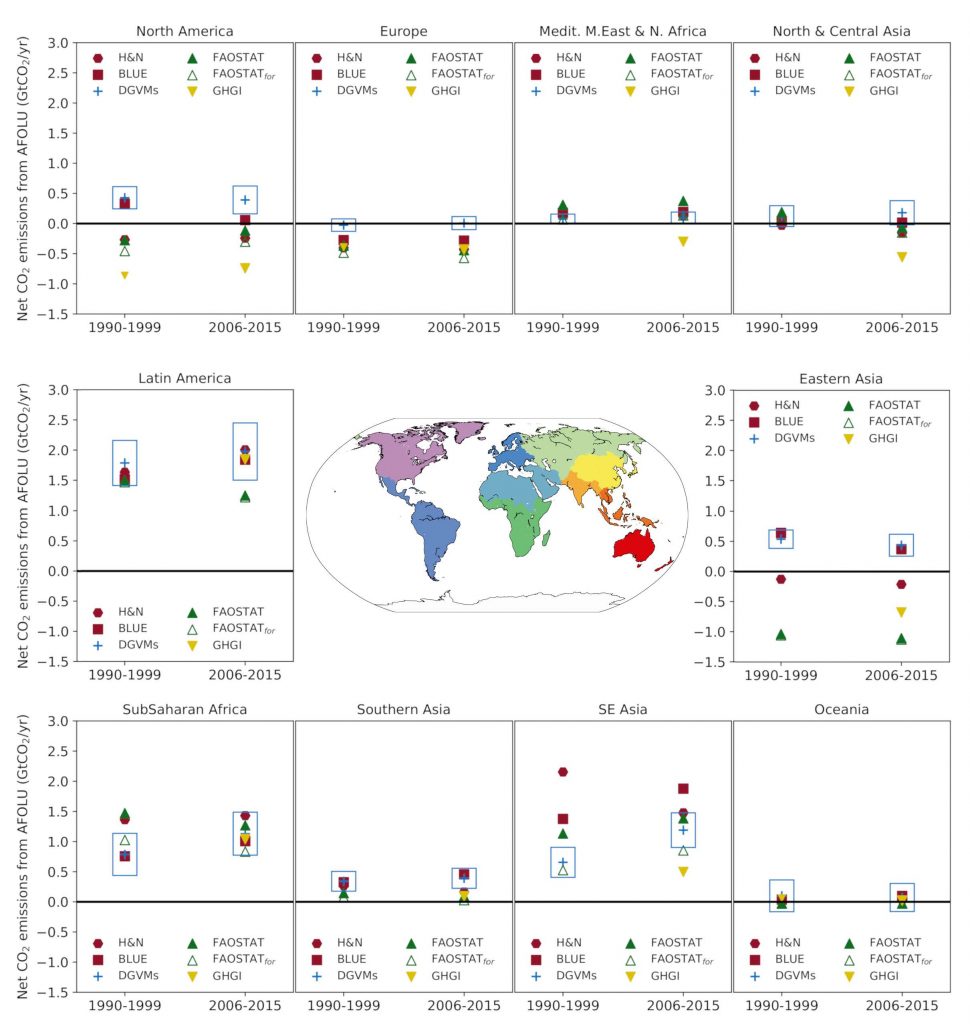
Global models and national GHG inventories use different methods to estimate anthropogenic CO2 emissions and removals for the land sector. Consideration of differences in methods can enhance understanding of land sector net emission such as under the Paris Agreement’s global stocktake (medium confidence). Both models and inventories produce estimates that are in close agreement for land-use change involving forest (e.g., deforestation, afforestation), and differ for managed forest. Global models consider as managed forest those lands that were subject to harvest whereas, consistent with IPCC guidelines, national GHG inventories define managed forest more broadly. On this larger area, inventories can also consider the natural response of land to human-induced environmental changes as anthropogenic, while the global model approach {Table SPM.1} treats this response as part of the non-anthropogenic sink. For illustration, from 2005 to 2014, the sum of the national GHG inventories net emission estimates is 0.1 ± 1.0 GtCO2 yr–1, while the mean of two global bookkeeping models is 5.1 ± 2.6 GtCO2 yr–1 (likely range).
The gross emissions from AFOLU (one-third of total global emissions) are more indicative of mitigation potential of reduced deforestation than the global net emissions (13% of total global emissions), which include compensating deforestation and afforestation fluxes (high confidence). The net flux of CO2 from AFOLU is composed of two opposing gross fluxes: (i) gross emissions (20 GtCO2 yr–1) from deforestation, cultivation of soils and oxidation of wood products, and (ii) gross removals (–14 GtCO2 yr–1), largely from forest growth following wood harvest and agricultural abandonment (medium confidence). {2.3.1}
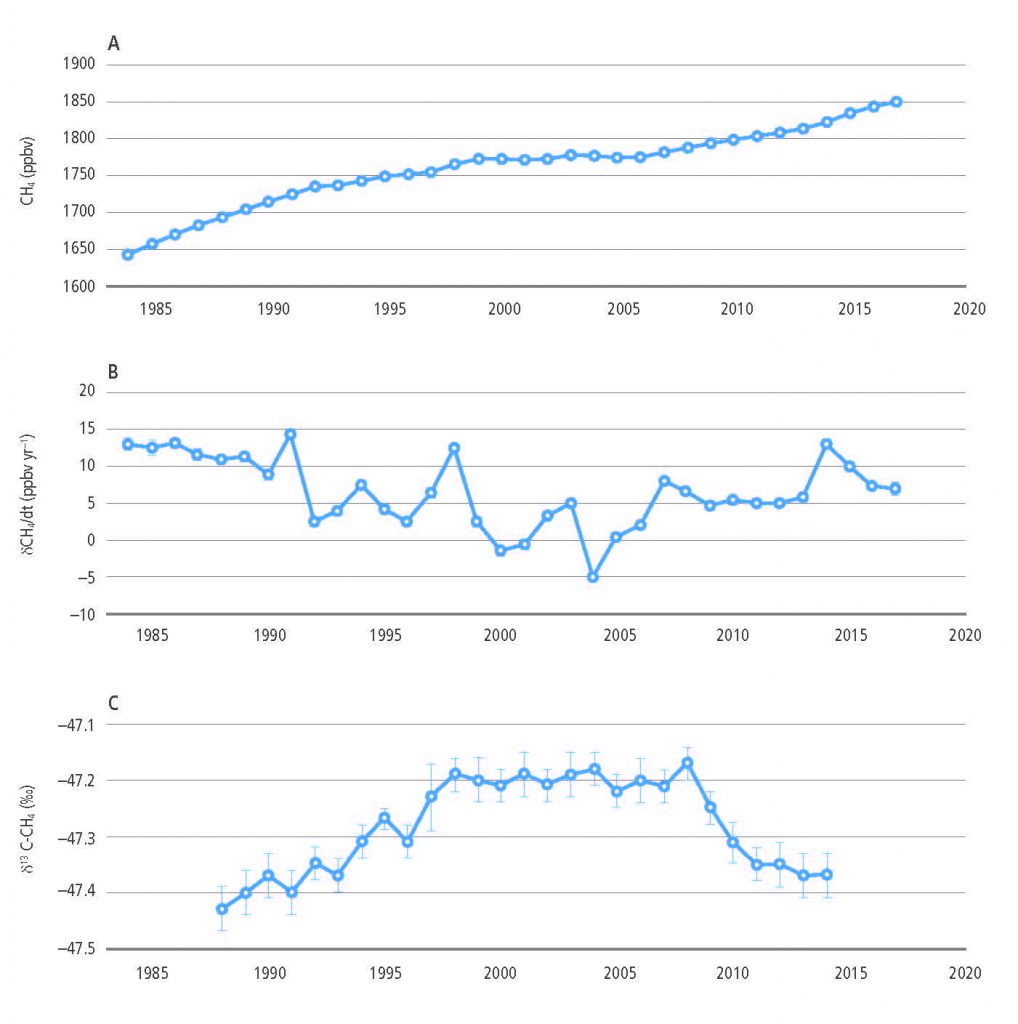
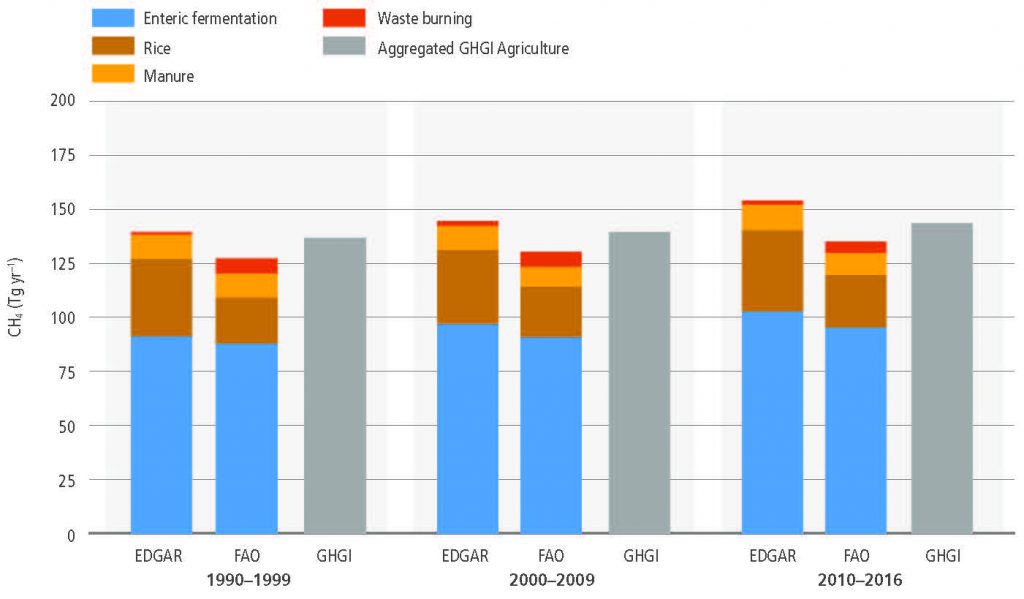
Land is a net source of CH4, accounting for 44% of anthropogenic CH4 emissions for the 2006–2017 period (medium confidence). The pause in the rise of atmospheric CH4 concentrations between 2000 and 2006 and the subsequent renewed increase appear to be partially associated with land use and land use change. The recent depletion trend of the 13C isotope in the atmosphere indicates that higher biogenic sources explain part of the current CH4 increase and that biogenic sources make up a larger proportion of the source mix than they did before 2000 (high confidence). In agreement with the findings of AR5, tropical wetlands and peatlands continue to be important drivers of inter- annual variability and current CH4 concentration increases (medium evidence, high agreement). Ruminants and the expansion of rice cultivation are also important contributors to the current trend (medium evidence, high agreement). There is significant and ongoing accumulation of CH4 in the atmosphere (very high confidence). {2.3.2}
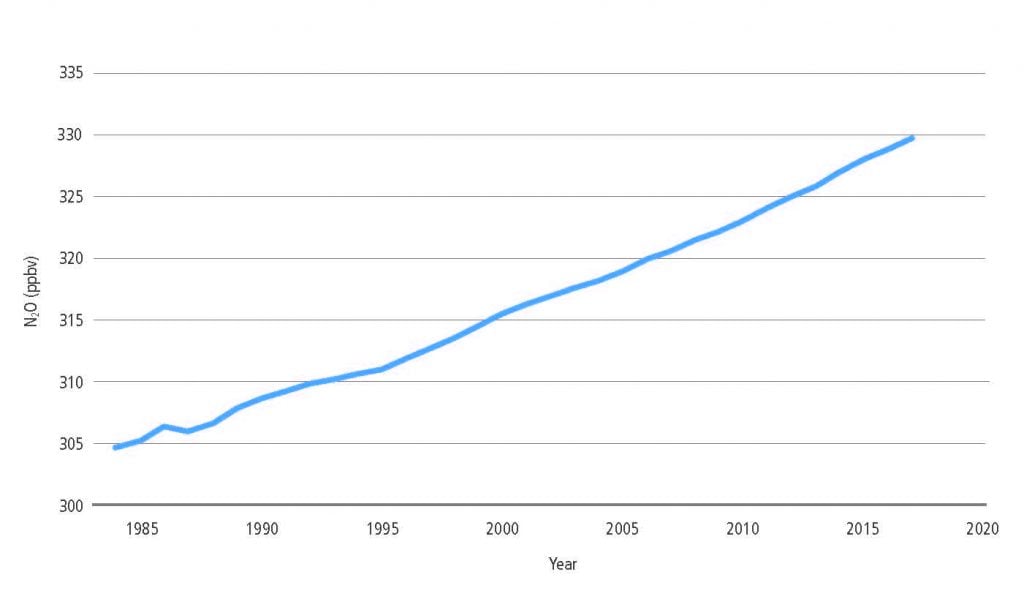
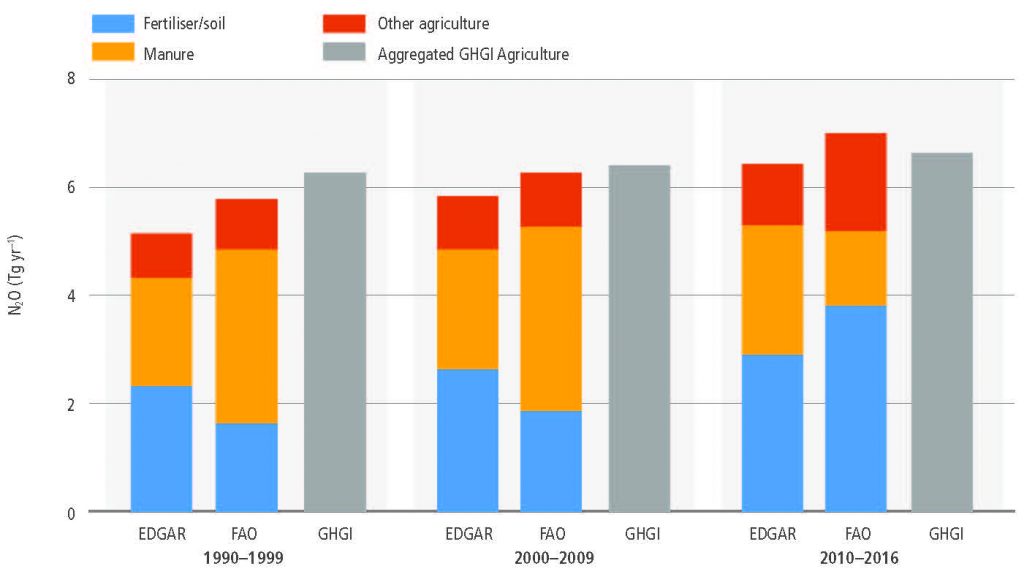
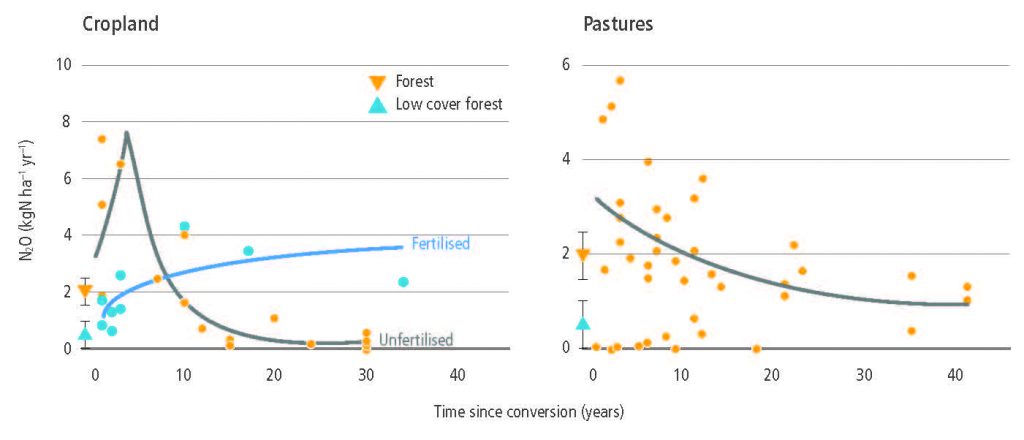
AFOLU is the main anthropogenic source of N2O primarily due to nitrogen application to soils (high confidence). In croplands, the main driver of N2O emissions is a lack of synchronisation between crop nitrogen demand and soil nitrogen supply, with approximately 50% of the nitrogen applied to agricultural land not taken up by the crop. Cropland soils emit over 3 MtN2O-N yr–1 (medium confidence). Because the response of N2O emissions to fertiliser application rates is non-linear, in regions of the world where low nitrogen application rates dominate, such as sub-Saharan Africa and parts of Eastern Europe, increases in nitrogen fertiliser use would generate relatively small increases in agricultural N2O emissions. Decreases in application rates in regions where application rates are high and exceed crop demand for parts of the growing season will have very large effects on emissions reductions (medium evidence, high agreement). {2.3.3}
While managed pastures make up only one-quarter of grazing lands, they contributed more than three-quarters of N2O emissions from grazing lands between 1961 and 2014 with rapid recent increases of nitrogen inputs resulting in disproportionate growth in emissions from these lands (medium confidence). Grazing lands (pastures and rangelands) are responsible for more than one-third of total anthropogenic N2O emissions or more than one-half of agricultural emissions (high confidence). Emissions are largely from North America, Europe, East Asia, and South Asia, but hotspots are shifting from Europe to southern Asia (medium confidence). {2.3.3}
Increased emissions from vegetation and soils due to climate change in the future are expected to counteract potential sinks due to CO2 fertilisation (low confidence). Responses of vegetation and soil organic carbon (SOC) to rising atmospheric CO2 concentration and climate change are not well constrained by observations (medium confidence). Nutrient (e.g., nitrogen, phosphorus) availability can limit future plant growth and carbon storage under rising CO2 (high confidence). However, new evidence suggests that ecosystem adaptation through plant-microbe symbioses could alleviate some nitrogen limitation (medium evidence, high agreement). Warming of soils and increased litter inputs will accelerate carbon losses through microbial respiration (high confidence). Thawing of high latitude/altitude permafrost will increase rates of SOC loss and change the balance between CO2 and CH4 emissions(medium confidence).Thebalancebetweenincreased respiration in warmer climates and carbon uptake from enhanced plant growth is a key uncertainty for the size of the future land carbon sink (medium confidence). {2.3.1, 2.7.2, Box 2.3}
Biophysical and biogeochemical land forcing and feedbacks to the climate system
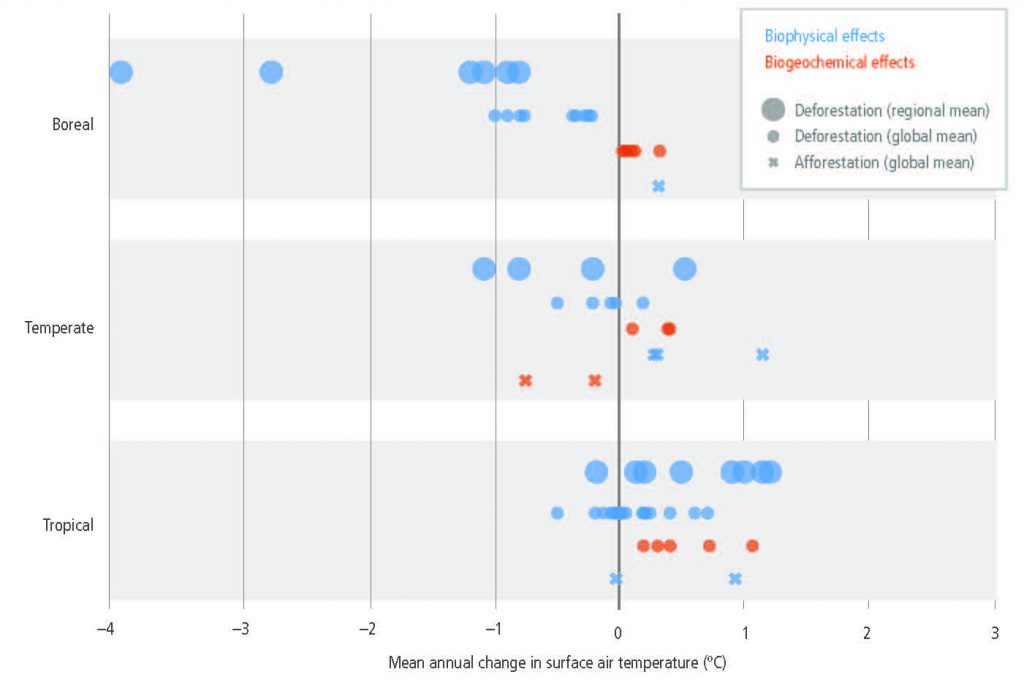
Changes in land conditions from human use or climate change in turn affect regional and global climate (high confidence). On the global scale, this is driven by changes in emissions or removals of CO2, CH4 and N2O by land (biogeochemical effects) and by changes in the surface albedo (very high confidence). Any local land changes that redistribute energy and water vapour between the land and the atmosphere influence regional climate (biophysical effects; high confidence). However, there is no confidence in whether such biophysical effects influence global climate. {2.1, 2.3, 2.5.1, 2.5.2}
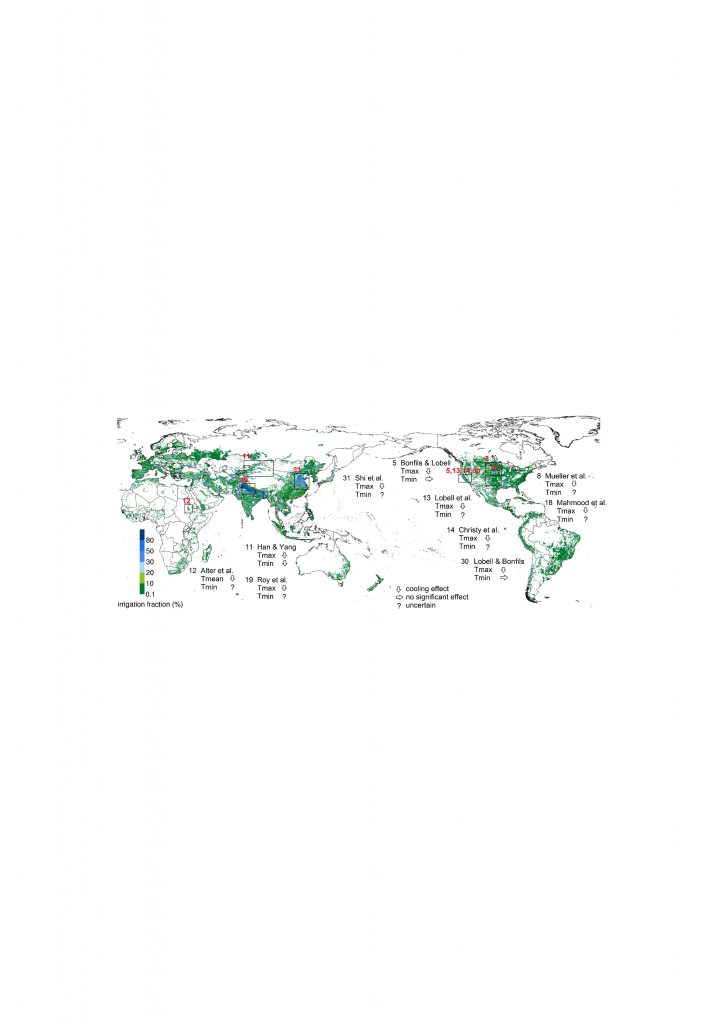
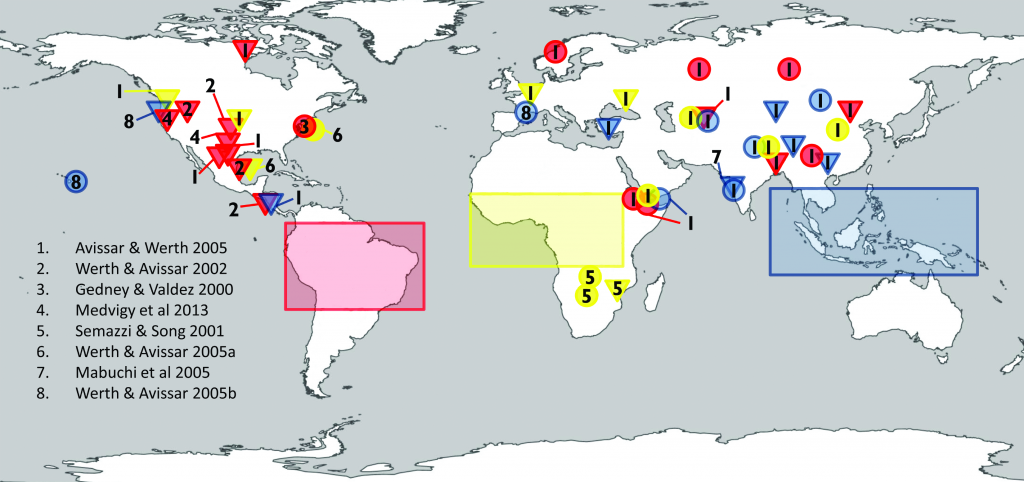
Changes in land conditions modulate the likelihood, intensity and duration of many extreme events including heatwaves (high confidence) and heavy precipitation events (medium confidence). Dry soil conditions favour or strengthen summer heatwave conditions through reduced evapotranspiration and increased sensible heat. By contrast wet soil conditions, for example from irrigation or crop management practices that maintain a cover crop all year round, can dampen extreme warm events through increased evapotranspiration and reduced sensible heat. Droughts can be intensified by poor land management. Urbanisation increases extreme rainfall events over or downwind of cities (medium confidence). {2.5.1, 2.5.2, 2.5.3}
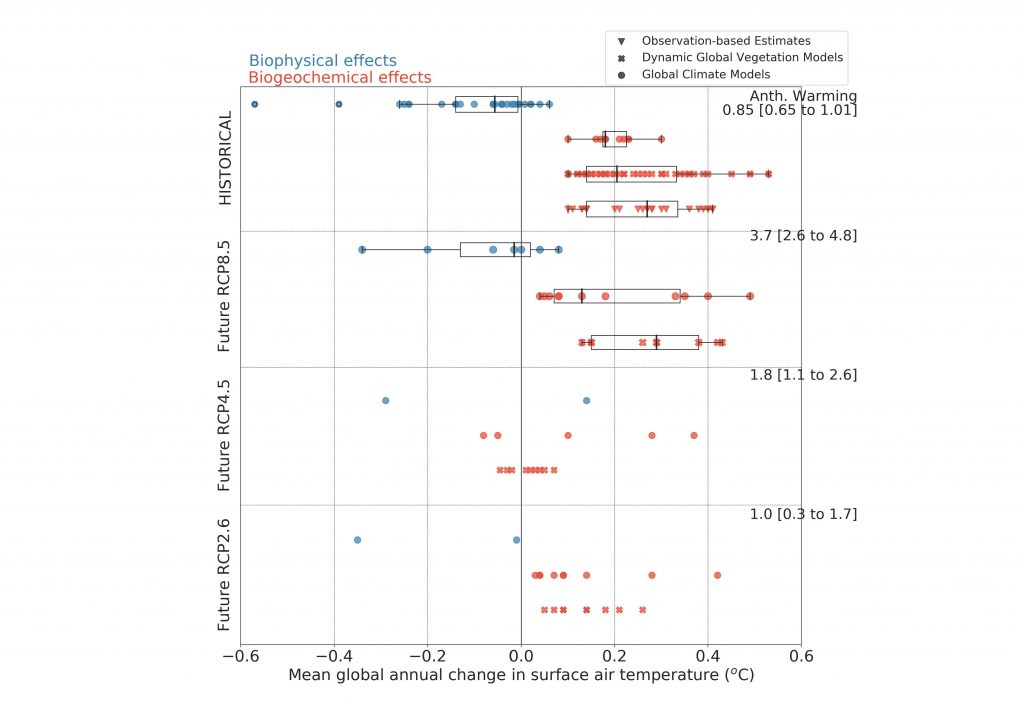
Historical changes in anthropogenic land cover have resulted in a mean annual global warming of surface air from biogeochemical effects (very high confidence), dampened by a cooling from biophysical effects (medium confidence). Biogeochemical warming results from increased emissions of GHGs by land, with model-based estimates of +0.20 ± 0.05°C (global climate models) and +0.24 ± 0.12°C – dynamic global vegetation models (DGVMs) as well as an observation-based estimate of +0.25 ± 0.10°C. A net biophysical cooling of –0.10 ± 0.14°C has been derived from global climate models in response to the increased surface albedo and decreased turbulent heat fluxes, but it is smaller than the warming effect from land-based emissions. However, when both biogeochemical and biophysical effects are accounted for within the same global climate model, the models do not agree on the sign of the net change in mean annual surface air temperature. {2.3, 2.5.1, Box 2.1}
The future projected changes in anthropogenic land cover that have been examined for AR5 would result in a biogeochemical warming and a biophysical cooling whose magnitudes depend on the scenario (high confidence). Biogeochemical warming has been projected for RCP8.5 by both global climate models (+0.20 ± 0.15°C) and DGVMs (+0.28 ± 0.11°C) (high confidence). A global biophysical cooling of 0.10 ± 0.14°C is estimated from global climate models and is projected to dampen the land-based warming (low confidence). For RCP4.5, the biogeochemical warming estimated from global climate models (+0.12 ± 0.17°C) is stronger than the warming estimated by DGVMs (+0.01 ± 0.04°C) but based on limited evidence, as is the biophysical cooling (–0.10 ± 0.21°C). {2.5.2}
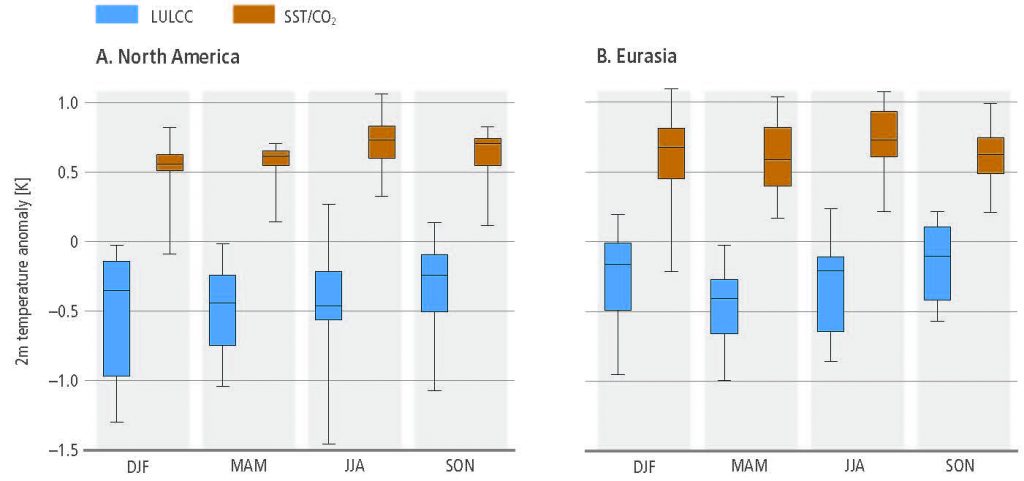
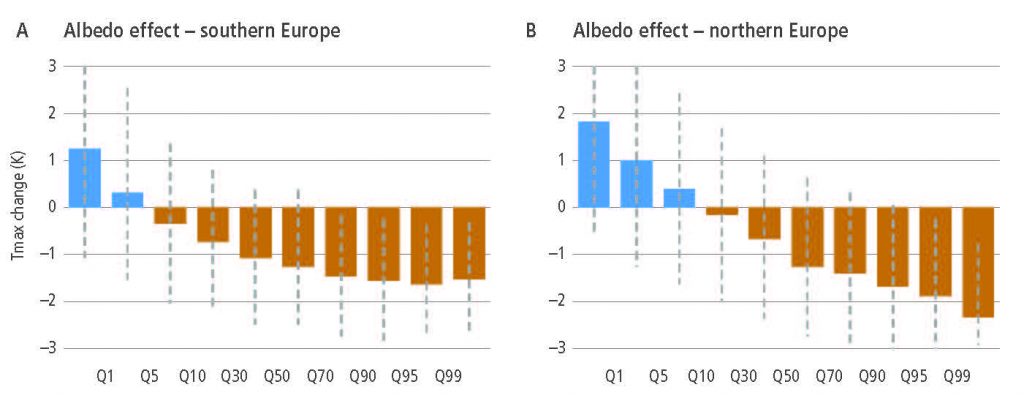
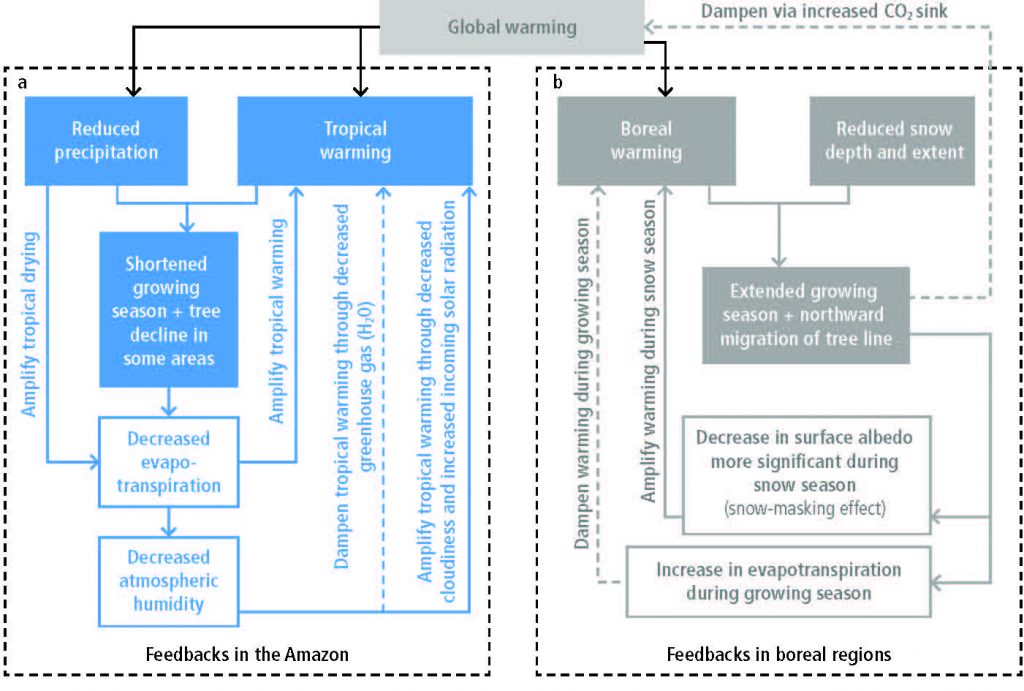
Regional climate change can be dampened or enhanced by changes in local land cover and land use (high confidence) but this depends on the location and the season (high confidence). In boreal regions, for example, where projected climate change will migrate the treeline northward, increase the growing season length and thaw permafrost, regional winter warming will be enhanced by decreased surface albedo and snow, whereas warming will be dampened during the growing season due to larger evapotranspiration (high confidence). In the tropics, wherever climate change will increase rainfall, vegetation growth and associated increase in evapotranspiration will result in a dampening effect on regional warming (medium confidence). {2.5.2, 2.5.3}
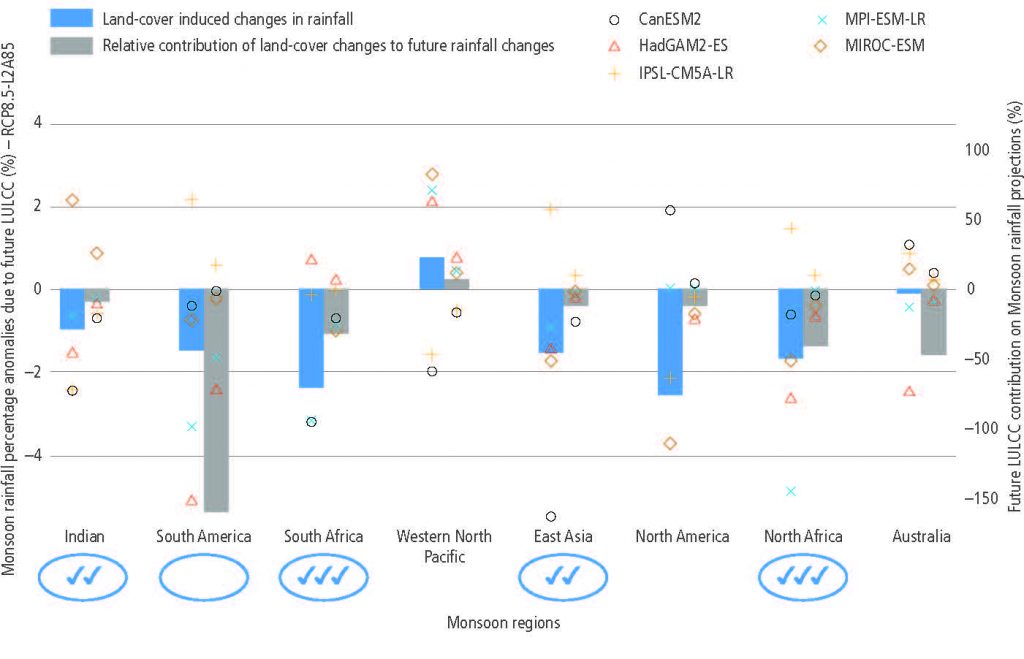
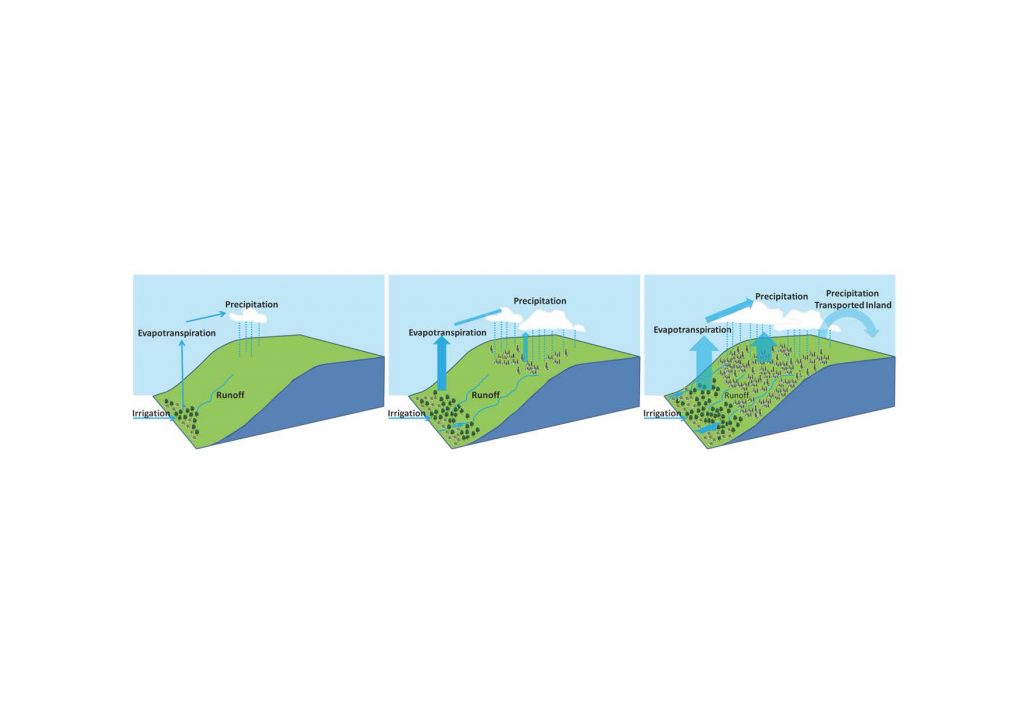
According to model-based studies, changes in local land cover or available water from irrigation will affect climate in regions as far as few hundreds of kilometres downwind (high confidence). The local redistribution of water and energy following the changes on land affect the horizontal and vertical gradients of temperature, pressure and moisture, thus altering regional winds and consequently moisture and temperature advection and convection and subsequently, precipitation. {2.5.2, 2.5.4, Cross-Chapter Box 4}
Future increases in both climate change and urbanisation will enhance warming in cities and their surroundings (urban heat island), especially during heatwaves (high confidence). Urban and peri-urban agriculture, and more generally urban greening, can contribute to mitigation (medium confidence) as well as to adaptation (high confidence), with co-benefits for food security and reduced soil-water-air pollution. {Cross-Chapter Box 4}
Regional climate is strongly affected by natural land aerosols (medium confidence) (e.g., mineral dust, black, brown and organic carbon), but there is low confidence in historical trends, inter-annual and decadal variability and future changes. Forest cover affects climate through emissions of biogenic volatile organic compounds (BVOC) and aerosols (low confidence). The decrease in the emissions of BVOC resulting from the historical conversion of forests to cropland has resulted in a positive radiative forcing through direct and indirect aerosol effects, a negative radiative forcing through the reduction in the atmospheric lifetime of methane and it has contributed to increased ozone concentrations in different regions (low confidence). {2.4, 2.5}
Consequences for the climate system of land-based adaptation and mitigation options, including carbon dioxide removal (negative emissions)
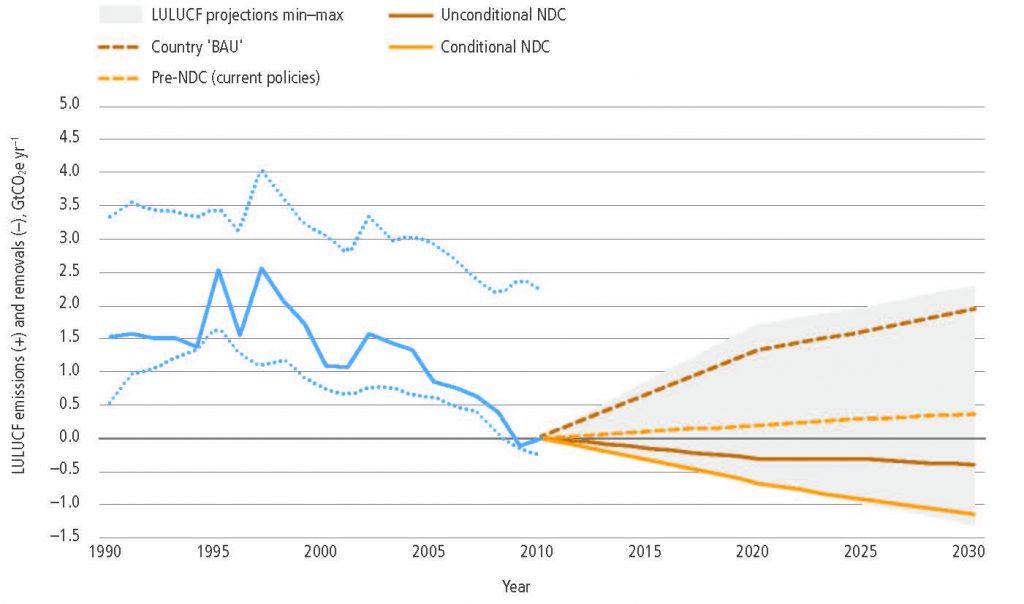
About one-quarter of the 2030 mitigation pledged by countries in their initial nationally determined contributions (NDCs) under the Paris Agreement is expected to come from land- based mitigation options (medium confidence). Most of the NDCs submitted by countries include land-based mitigation, although many lack details. Several refer explicitly to reduced deforestation and forest sinks, while a few include soil carbon sequestration, agricultural management and bioenergy. Full implementation of NDCs (submitted by February 2016) is expected to result in net removals of 0.4–1.3 GtCO2 yr–1 in 2030 compared to the net flux in 2010, where the range represents low to high mitigation ambition in pledges, not uncertainty in estimates (medium confidence). {2.6.3}
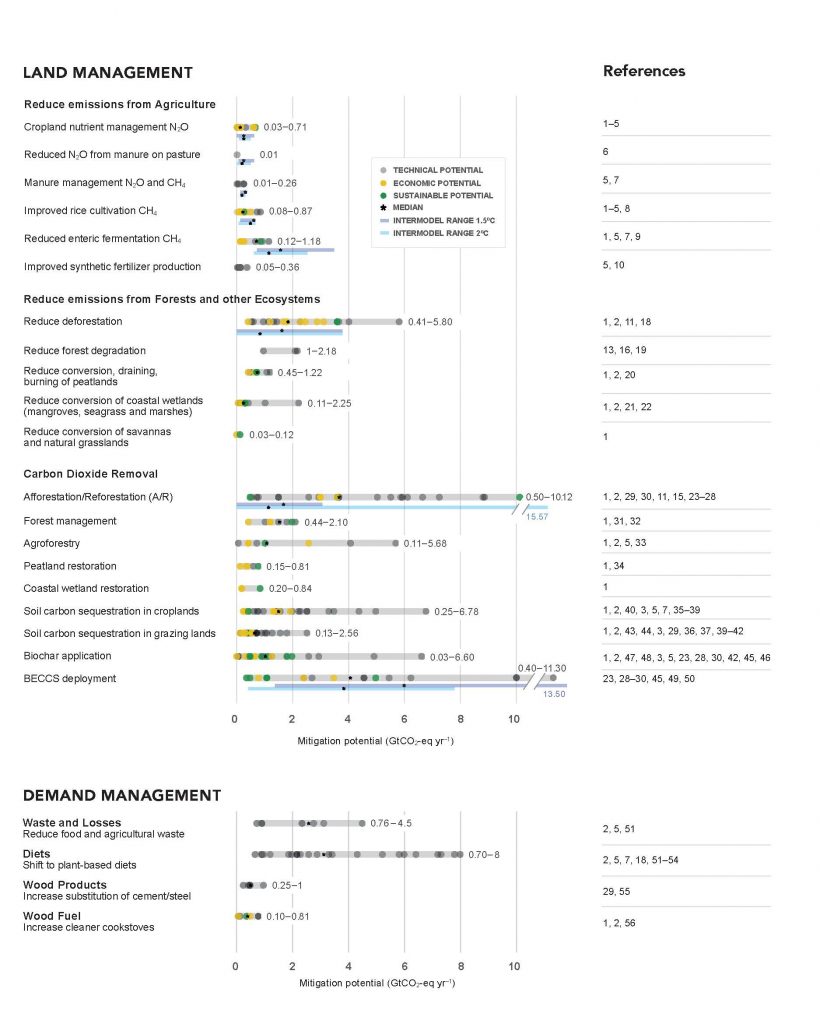
Several mitigation response options have technical potential for >3 GtCO2-eq yr–1 by 2050 through reduced emissions and Carbon Dioxide Removal (CDR) (high confidence), some of which compete for land and other resources, while others may reduce the demand for land (high confidence). Estimates of the technical potential of individual response options are not necessarily additive. The largest potential for reducing AFOLU emissions are through reduced deforestation and forest degradation (0.4–5.8 GtCO2-eq yr–1) (high confidence), a shift towards plant- based diets (0.7–8.0 GtCO2-eq yr–1) (high confidence) and reduced food and agricultural waste (0.8–4.5 GtCO2-eq yr–1) (high confidence). Agriculture measures combined could mitigate 0.3–3.4 GtCO2-eq yr–1 (medium confidence). The options with largest potential for CDR are afforestation/reforestation (0.5–10.1 GtCO2-eq yr–1) (medium confidence), soil carbon sequestration in croplands and grasslands (0.4–8.6 GtCO2-eq yr–1) (high confidence) and Bioenergy with Carbon Capture and Storage (BECCS) (0.4–11.3 GtCO2-eq yr–1) (medium confidence). While some estimates include sustainability and cost considerations, most do not include socio-economic barriers, the impacts of future climate change or non-GHG climate forcings. {2.6.1}
Response options intended to mitigate global warming will also affect the climate locally and regionally through biophysical effects (high confidence). Expansion of forest area, for example, typically removes CO2 from the atmosphere and thus dampens global warming (biogeochemical effect, high confidence), but the biophysical effects can dampen or enhance regional warming depending on location, season and time of day. During the growing season, afforestation generally brings cooler days from increased evapotranspiration, and warmer nights (high confidence). During the dormant season, forests are warmer than any other land cover, especially in snow-covered areas where forest cover reduces albedo (high confidence). At the global level, the temperature effects of boreal afforestation/reforestation run counter to GHG effects, while in the tropics they enhance GHG effects. In addition, trees locally dampen the amplitude of heat extremes (medium confidence). {2.5.2, 2.5.4, 2.7, Cross-Chapter Box 4}
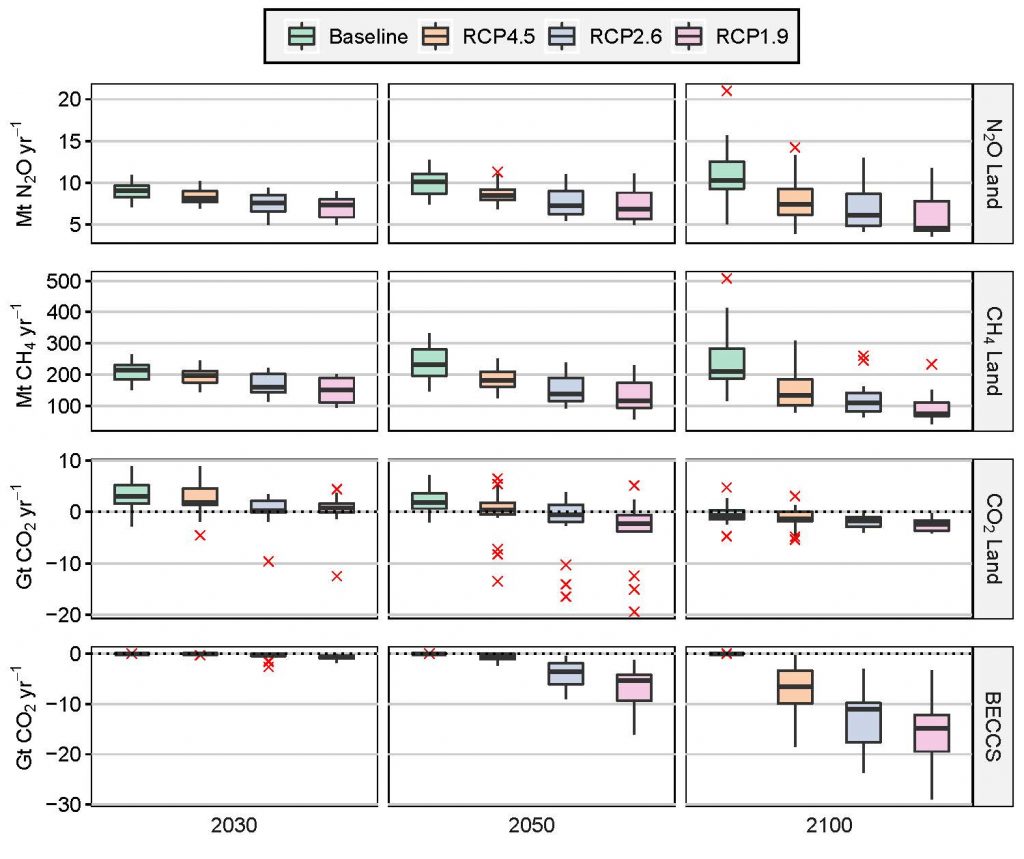
Mitigation response options related to land use are a key element of most modelled scenarios that provide strong mitigation, alongside emissions reduction in other sectors (high confidence). More stringent climate targets rely more heavily on land-based mitigation options, in particular, CDR (high confidence). Across a range of scenarios in 2100, CDR is delivered by both afforestation (median values of –1.3, –1.7 and –2.4 GtCO2 yr–1 for scenarios RCP4.5, RCP2.6 and RCP1.9 respectively) and bioenergy with carbon capture and storage (BECCS) (–6.5, –11 and –14.9 GtCO2 yr–1 respectively). Emissions of CH4 and N2O are reduced through improved agricultural and livestock management as well as dietary shifts away from emission-intensive livestock products by 133.2, 108.4 and 73.5 MtCH4 yr–1; and 7.4, 6.1 and 4.5 MtN2O yr–1 for the same set of scenarios in 2100 (high confidence). High levels of bioenergy crop production can result in increased N2O emissions due to fertiliser use. The Integrated Assessment Models that produce these scenarios mostly neglect the biophysical effects of land-use on global and regional warming. {2.5, 2.6.2}
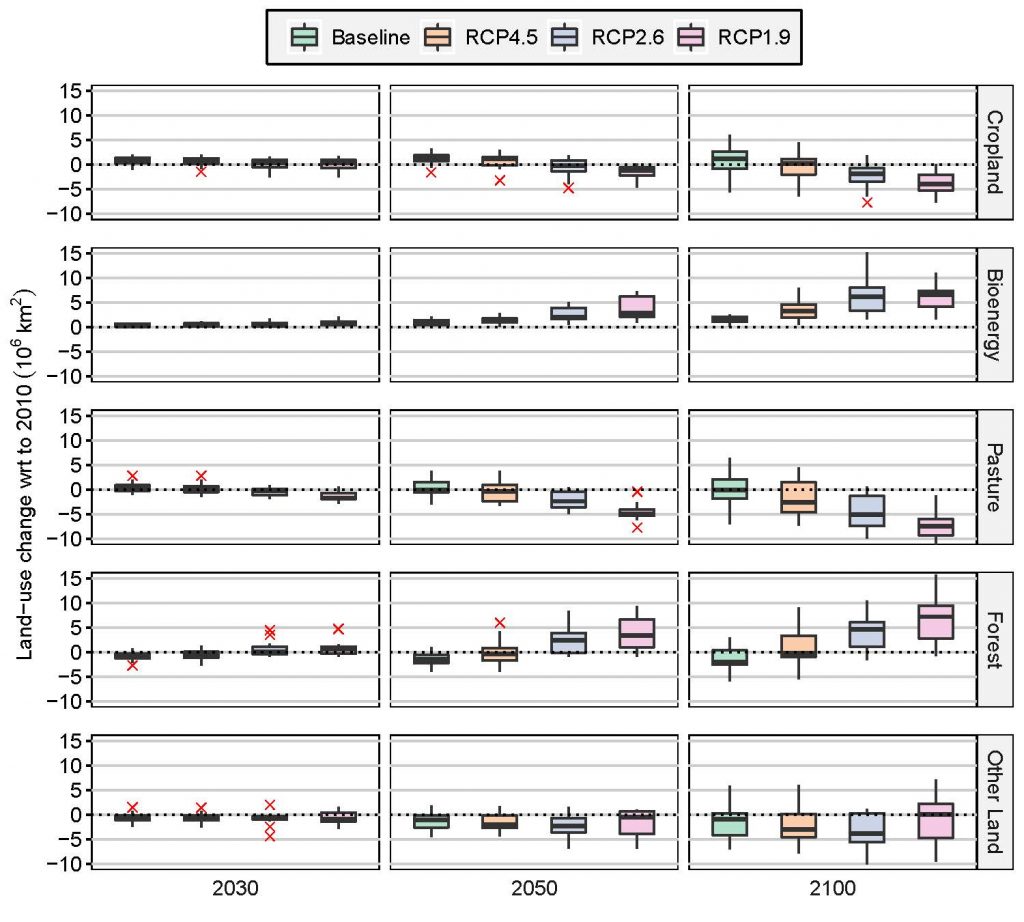
Large-scale implementation of mitigation response options that limit warming to 1.5°C or 2°C would require conversion of large areas of land for afforestation/reforestation and bioenergy crops, which could lead to short-term carbon losses (high confidence). The change of global forest area in mitigation pathways ranges from about –0.2 to +7.2 Mkm2 between 2010 and 2100 (median values across a range of models and scenarios: RCP4.5, RCP2.6, RCP1.9), and the land demand for bioenergy crops ranges from about 3.2 to 6.6 Mkm2 in 2100 (high confidence). Large- scale land-based CDR is associated with multiple feasibility and sustainability constraints (Chapters 6 and 7). In high carbon lands such as forests and peatlands, the carbon benefits of land protection are greater in the short-term than converting land to bioenergy crops for BECCS, which can take several harvest cycles to ‘pay-back’ the carbon emitted during conversion (carbon-debt), from decades to over a century (medium confidence). {2.6.2, Chapters 6, 7}
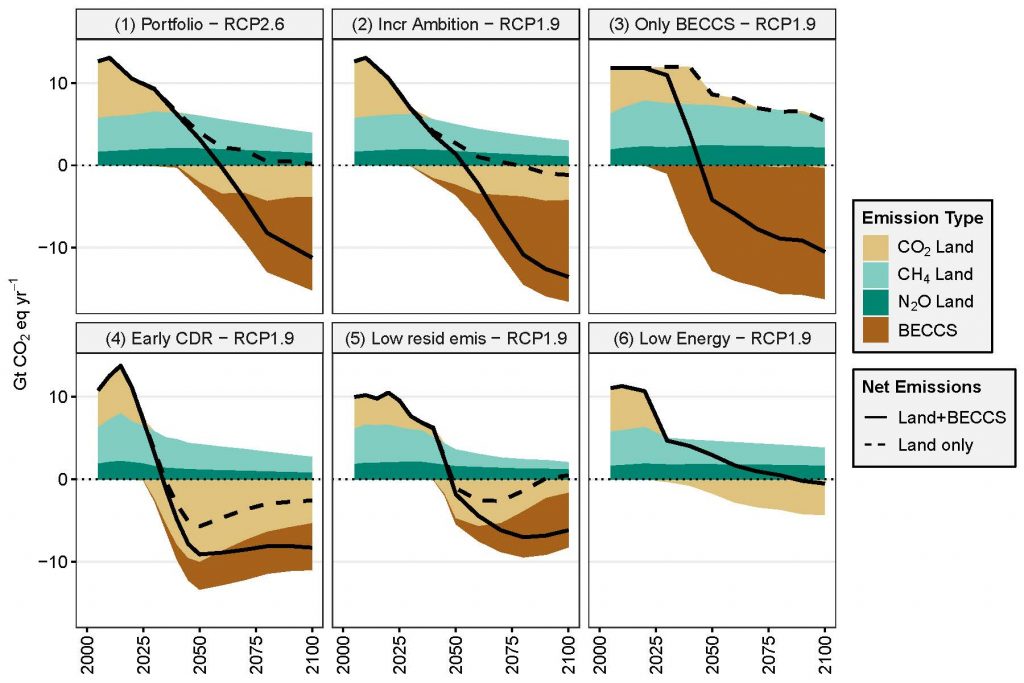
It is possible to achieve climate change targets with low need for land-demanding CDR such as BECCS, but such scenarios rely more on rapidly reduced emissions or CDR from forests, agriculture and other sectors. Terrestrial CDR has the technical potential to balance emissions that are difficult to eliminate with current technologies (including food production). Scenarios that achieve climate change targets with less need for terrestrial CDR rely on agricultural demand-side changes (diet change, waste reduction), and changes in agricultural production such as agricultural intensification. Such pathways that minimise land use for bioenergy and BECCS are characterised by rapid and early reduction of GHG emissions in all sectors, as well as earlier CDR in through afforestation. In contrast, delayed mitigation action would increase reliance on land-based CDR (high confidence). {2.6.2}
