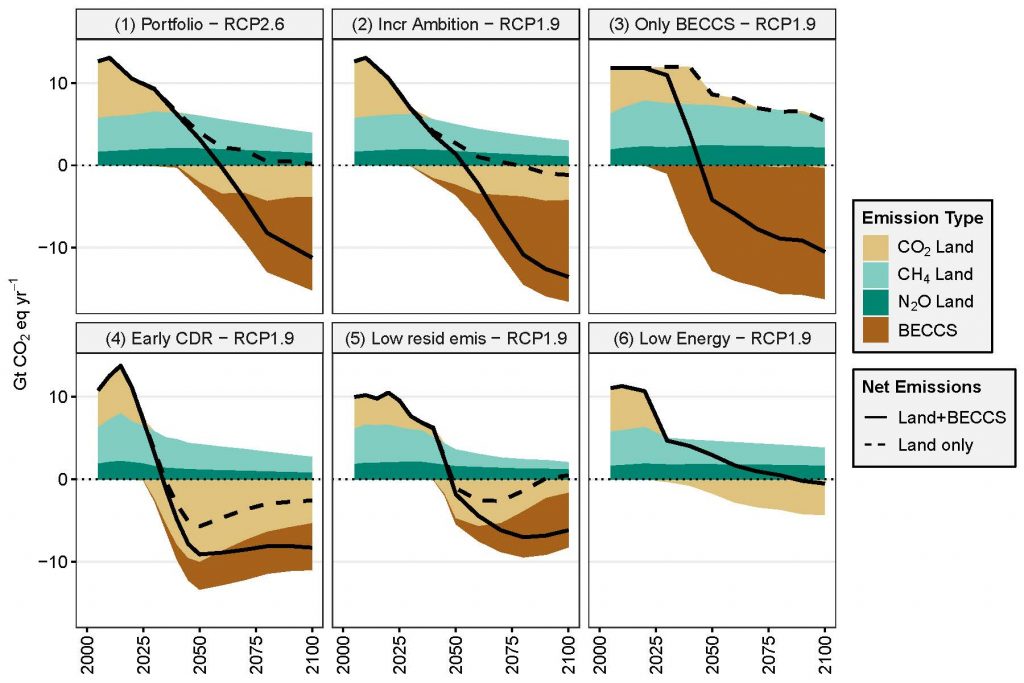
Figure 2.27
Evolution and breakdown of global land-based GHG emissions and removals under six alternative mitigation pathways.This figure illustrates the differences in timing and magnitude of land-based mitigation approaches including afforestation and BECCS. All pathways are based on different IAM realisations of SSP2. Pathway 1 is based on RCP 2.6, while all other pathways are based on RCP 1.9. Pathway 1: MESSAGE-GLOBIOM (Fricko et al. 2017); Pathway 2: MESSAGE-GLOBIOM (Rogelj et al. 2018); Pathway 3: REMIND-MAgPIE (Kriegler et al. 2017); Pathway 4: REMIND-MAgPIE (Bertram et al. 2018); Pathway 5: IMAGE (van Vuuren et al. 2018); Pathway 6: MESSAGE-GLOBIOM (Grubler et al. 2018). Data is from an update of the IAMC Scenario Explorer developed for the SR15 (Rogelj et al. 2018). The categories CO2 Land, CH4 Land and N2O Land include GHG emissions from land-use change and agricultural land use (including emissions related to bioenergy production). In addition, the category CO2 Land includes negative emissions due to afforestation. BECCS reflects the CO2 emissions captured from bioenergy use and stored in geological deposits. Solid lines show the net effect of all land based GHG emissions and removals (CO2 Land, CH4 Land, N2O Land and BECCS), while dashed lines show the net effect excluding BECCS. CH4 and N2O emissions are converted to CO2-eq using GWP factors of 28 and 265 respectively.