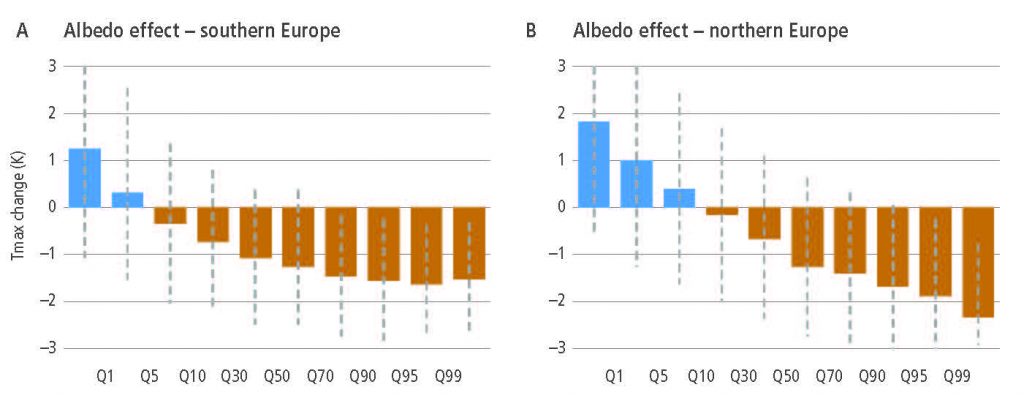
Change in summer (July–August) daily maximum temperature (ºC) resulting from increased surface albedo in unploughed versus ploughed land, in (A) southern, and (B) northern Europe, during the period 1986–2009. Changes are simulated for different quantiles of the daily maximum temperature distribution, where Q1 represents the coolest 1% and Q99 the warmest 1% of summer days. Only grid cells with more than 60% of their area in cropland are included. The dashed bars represent the standard deviation calculated across all days and grid points. SE refers to southern Europe (below 45ºN) and NE to northern Europe (above 45ºN). (Davin et al., 2014)