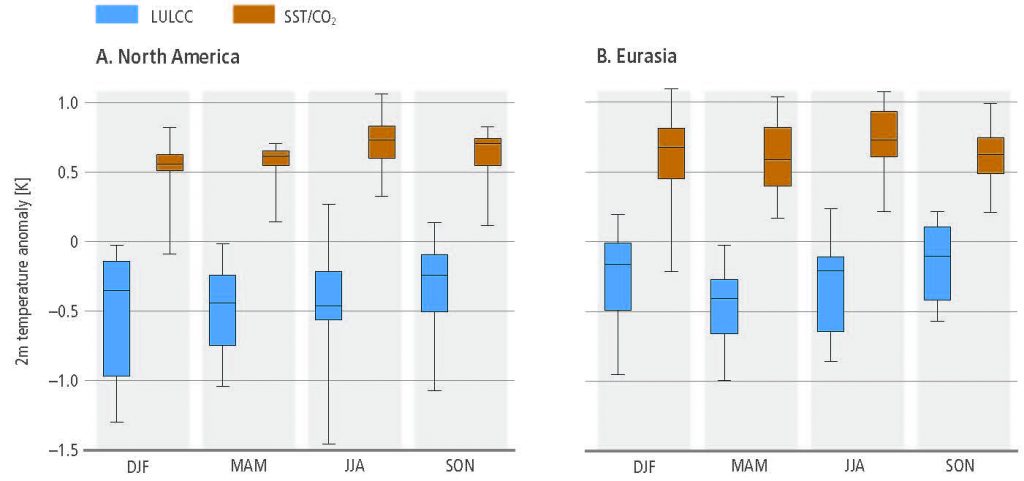
Figure 2.15
Simulated changes in mean surface air temperature (ºC) between the pre-industrial period (1870–1900) and the present-day (1972–2002) for all seasons and for (A) North America and (B) Eurasia.Source: De Noblet-Ducoudré et al. (2012). Brown boxes are the changes simulated in response to increased atmospheric GHG content between both time periods and subsequent changes in sea-surface temperature and sea-ice extent (SST/CO2). The CO2 changes accounted for include emissions from all sources, including land use. Blue boxes are the changes simulated in response to the biophysical effects of historical land cover changes. The box-and-whisker plots have been drawn using results from seven climate models and ensembles of 10 simulations per model and time period. The bottom and top of each grey box are the 25th and 75th percentiles, and the horizontal line within each box is the 50th percentile (the median). The whiskers (straight lines) indicate the ensemble maximum and minimum values. Seasons are respectively December-January-February (DJF), March-April-May (MAM), June-July-August (JJA) and September-October-November (SON). North America and Eurasia are extended regions where land-use changes are the largest between the two time periods considered (their contours can be found in Figure 1 of De Noblet-Ducoudré et al. (2012).