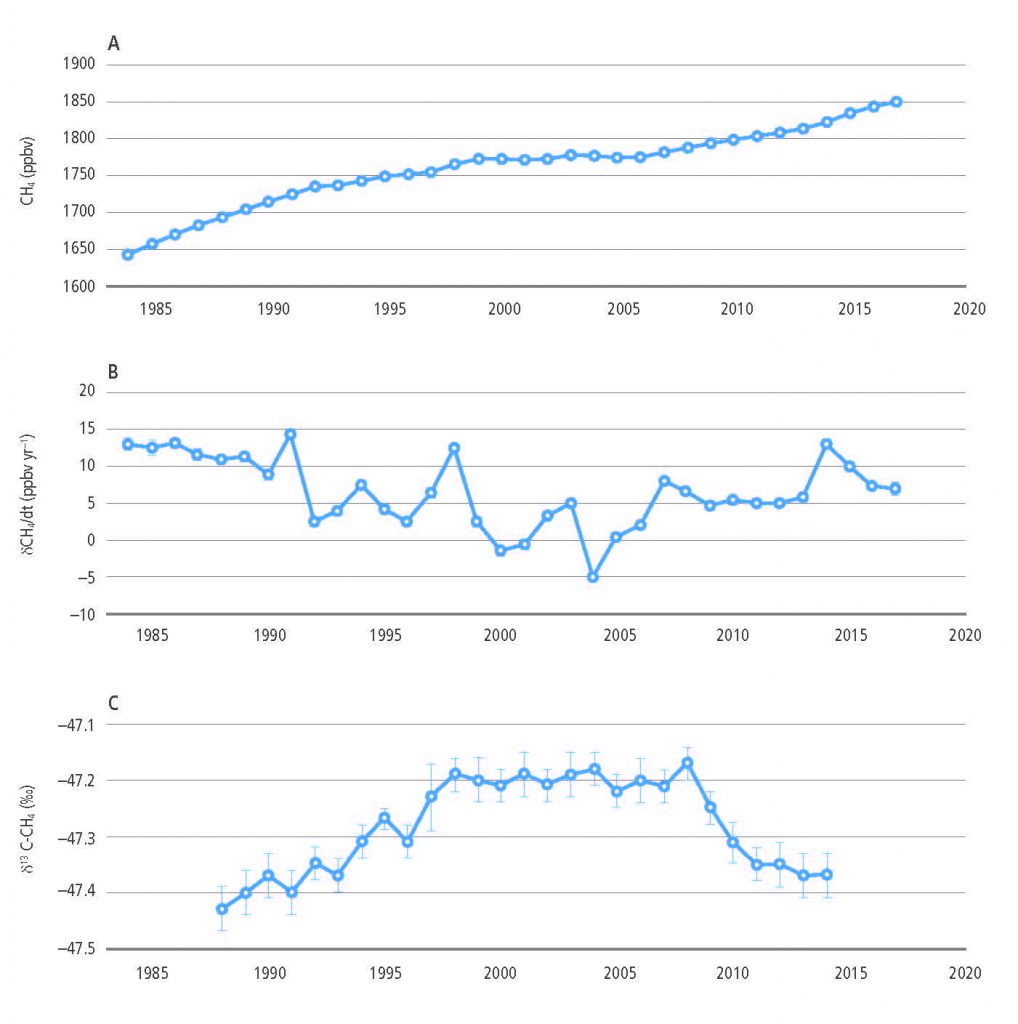
Globally averaged atmospheric CH4 mixing ratios (Frame A) and instantaneous rates of change (Frame B) and C isotope/variation (Frame C). Data sources: NOAA/ESRL (www.esrl.noaa.gov/gmd/ccgg/trends_ch4); Dlugokencky et al. (1994) and Schaefer et al. (2016).