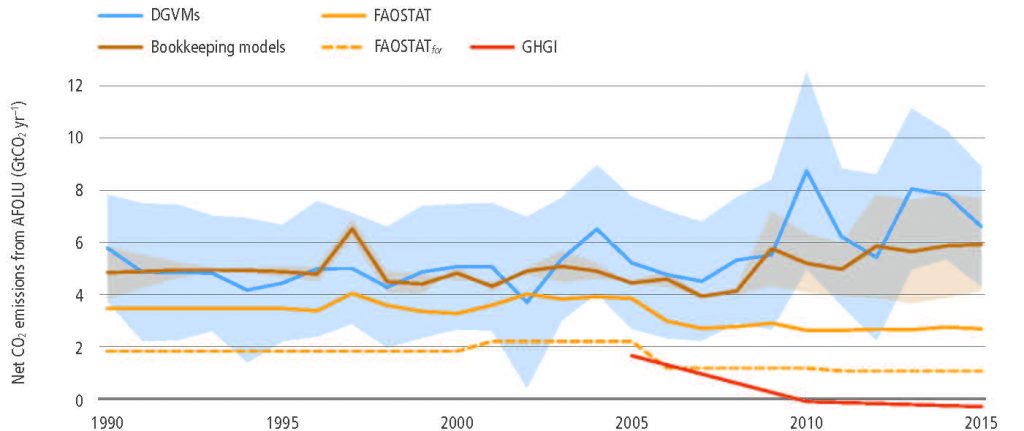
Global net CO2 emissions due to AFOLU from different approaches (in GtCO2 yr–1).Brown line: the mean and individual estimates (brown shading) from two bookkeeping models (Houghton and Nassikas 2017; Hansis et al. 2015). Blue line: the mean from DGVMs run with the same driving data with the pale blue shading showing the ±1 standard deviation range. Yellow line: data downloaded from FAOSTAT website (Tubiello et al. 2013); the dashed line is primarily forest-related emissions, while the solid yellow line also includes emissions from peat fires and peat draining. Orange line: Greenhouse Gas Inventories (GHGI) based on country reports to UNFCCC (Grassi et al. 2018), data are shown only from 2005 because reporting in many developing countries became more consistent/reliable after this date. For more details on methods see Box 2.2.