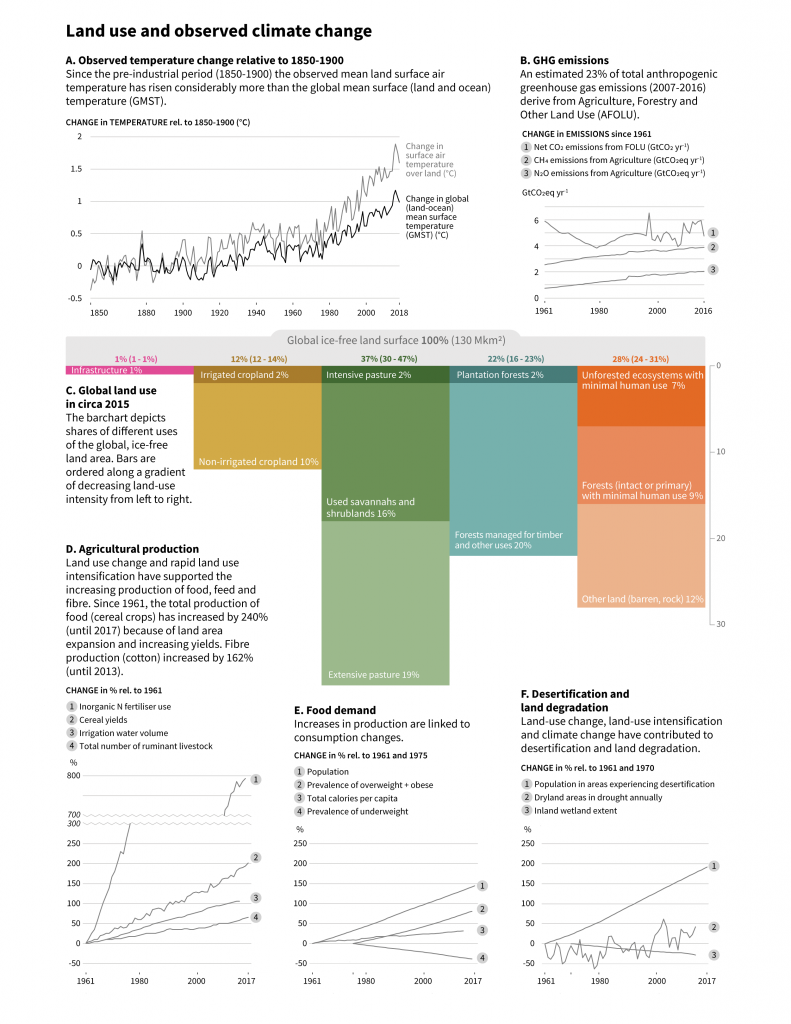
Figure 1.1
A representation of the principal land challenges and land-climate system processes covered in this assessment report.
A. The warming curves are averages of four datasets (Section 2.1, Figure 2.2 and Table 2.1). B. N2O and CH4 from agriculture are from FAOSTAT; Net land-use change emissions of CO2 from forestry and other land use (including emissions from peatland fires since 1997) are from the annual Global Carbon Budget, using the mean of two bookkeeping models. All values expressed in units of CO2-eq are based on AR5 100-year Global Warming Potential values without climate-carbon feedbacks (N2O = 265; CH4 = 28) (Table SPM.1 and Section 2.3). C. Depicts shares of different uses of the global, ice-free land area for approximately the year 2015, ordered along a gradient of decreasing land-use intensity from left to right. Each bar represents a broad land cover category; the numbers on top are the total percentage of the ice-free area covered, with uncertainty ranges in brackets. Intensive pasture is defined as having a livestock density greater than 100 animals/km². The area of ‘forest managed for timber and other uses’ was calculated as total forest area minus ‘primary/intact’ forest area. (Section 1.2, Table 1.1, Figure 1.3). D. Note that fertiliser use is shown on a split axis (source: International Fertiliser Industry Association, www.ifastat.org/databases). The large percentage change in fertiliser use reflects the low level of use in 1961 and relates to both increasing fertiliser input per area as well as the expansion of fertilised cropland and grassland to increase food production (1.1, Figure 1.3). E. Overweight population is defined as having a body mass index (BMI) >25 kg m–2 (source: Abarca-Gómez et al. 2017); underweight is defined as BMI <18.5 kg m–2. (Population density, source: United Nations, Department of Economic and Social Affairs 2017) (Sections 5.1 and 5.2). F. Dryland areas were estimated using TerraClimate precipitation and potential evapotranspiration (1980–2015) (Abatzoglou et al. 2018) to identify areas where the Aridity Index is below 0.65. Areas experiencing human caused desertification, after accounting for precipitation variability and CO2 fertilisation, are identified in Le et al. 2016. Population data for these areas were extracted from the gridded historical population database HYDE3.2 (Goldewijk et al. 2017). Areas in drought are based on the 12-month accumulation Global Precipitation Climatology Centre Drought Index (Ziese et al. 2014). The area in drought was calculated for each month (Drought Index below –1), and the mean over the year was used to calculate the percentage of drylands in drought that year. The inland wetland extent (including peatlands) is based on aggregated data from more than 2000 time series that report changes in local wetland area over time (Dixon et al. 2016; Darrah et al. 2019) (Sections 3.1, 4.2 and 4.6).