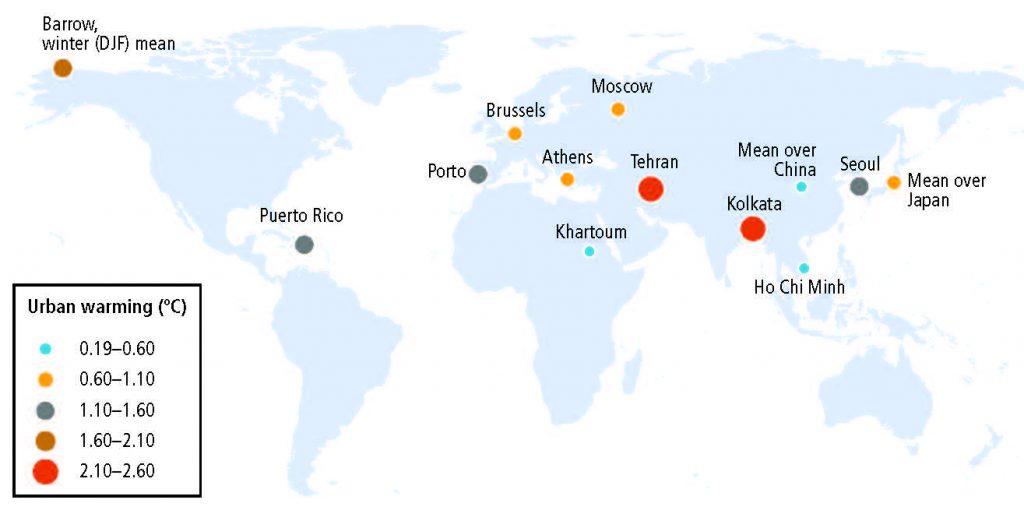
Change in annual mean surface air temperature resulting from urbanisation (ºC). The colour and size of the circles refer to the magnitude of the change. (This map has been compiled using the following studies: Kim et al. (2016), Sun et al. (2016), Chen et al. (2016a), Founda et al. (2015), Rafael et al. (2017), Hinkel and Nelson (2007), Chrysanthou et al. (2014), Dou et al. (2014), Zhou et al. (2016), (2017), Polydoros et al. (2018), Li et al. (2018a), Bader et al. (2018), Alizadeh-Choobari et al. (2016), Fujibe (2009), Lokoshchenko (2017), Torres-Valcárcel et al. (2015), Doan et al. (2016), Elagib (2011), Liao et al. (2017)).