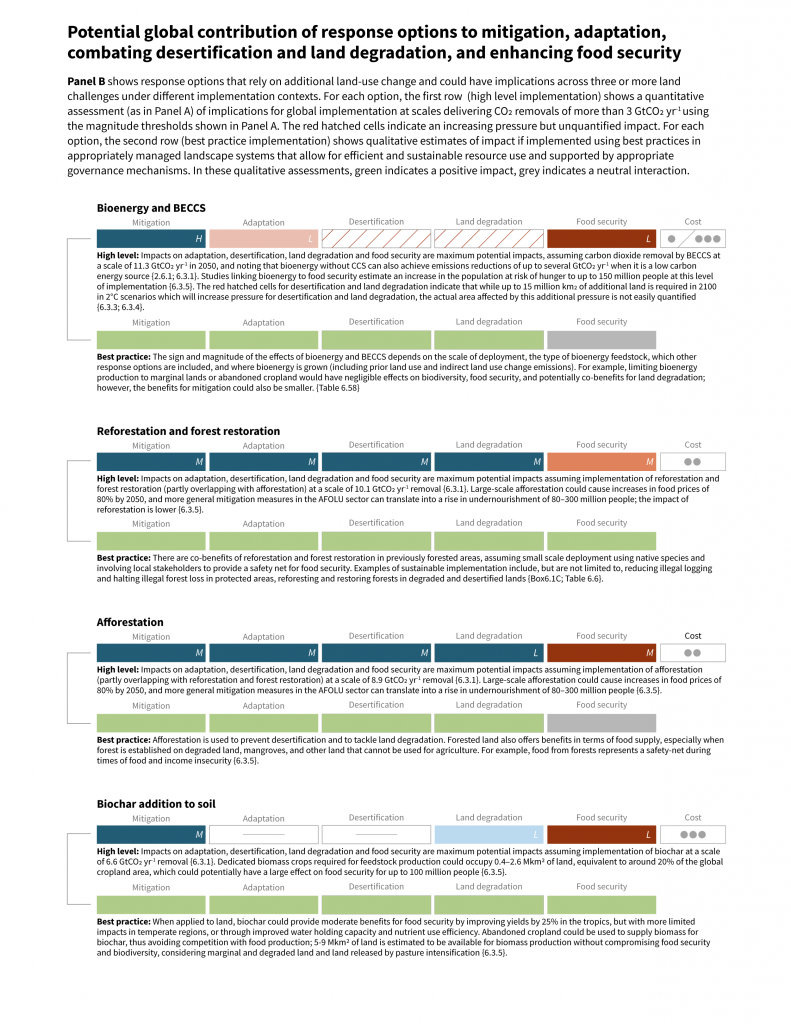
Figure SPM.3B
This Figure is based on an aggregation of information from studies with a wide variety of assumptions about how response options are implemented and the contexts in which they occur. Response options implemented differently at local to global scales could lead to different outcomes. Magnitude of potential: For panel A, magnitudes are for the technical potential of response options globally. For each land challenge, magnitudes are set relative to a marker level as follows. For mitigation, potentials are set relative to the approximate potentials for the response options with the largest individual impacts (~3 GtCO2-eq yr-1). The threshold for the ‘large’ magnitude category is set at this level. For adaptation, magnitudes are set relative to the 100 million lives estimated to be affected by climate change and a carbon-based economy between 2010 and 2030. The threshold for the ‘large’ magnitude category represents 25% of this total. For desertification and land degradation, magnitudes are set relative to the lower end of current estimates of degraded land, 10–60 million km2. The threshold for the ‘large’ magnitude category represents 30% of the lower estimate. For food security, magnitudes are set relative to the approximately 800 million people who are currently undernourished. The threshold for the ‘large’ magnitude category represents 12.5% of this total. For panel B, for the first row (high level implementation) for each response option, the magnitude and thresholds are as defined for panel A. In the second row (best practice implementation) for each response option, the qualitative assessments that are green denote potential positive impacts, and those shown in grey indicate neutral interactions. Increased food production is assumed to be achieved through sustainable intensification rather than through injudicious application of additional external inputs such as agrochemicals. Levels of confidence: Confidence in the magnitude category (high, medium or low) into which each option falls for mitigation, adaptation, combating desertification and land degradation, and enhancing food security. High confidence means that there is a high level of agreement and evidence in the literature to support the categorisation as high, medium or low magnitude. Low confidence denotes that the categorisation of magnitude is based on few studies. Medium confidence reflects medium evidence and agreement in the magnitude of response. Cost ranges: Cost estimates are based on aggregation of often regional studies and vary in the components of costs that are included. In panel B, cost estimates are not provided for best practice implementation. One coin indicates low cost (<USD10 tCO2-eq-1 or <USD20 ha-1), two coins indicate medium cost (USD10-USD100 tCO2-eq-1 or USD20 –USD200 ha-1), and three coins indicate high cost (>USD100 tCO2-eq-1 or USD200 ha-1). Thresholds in USD ha-1 are chosen to be comparable, but precise conversions will depend on the response option. Supporting evidence: Supporting evidence for the magnitude of the quantitative potential for land management-based response options can be found as follows: for mitigation Table’s 6.13 to 6.20, with further evidence in Section 2.7.1; for adaptation Table’s 6.21 to 6.28; for combating desertification Table’s 6.29 to 6.36, with further evidence in Chapter 3; for combating degradation tables 6.37 to 6.44, with further evidence in Chapter 4; for enhancing food security Table’s 6.45 to 6.52, with further evidence in Chapter 5. Other synergies and trade-offs not shown here are discussed in Chapter 6. Additional supporting evidence for the qualitative assessments in the second row for each option in panel B can be found in the Table’s 6.6, 6.55, 6.56 and 6.58, Section 6.3.5.1.3, and Box 6.1c.