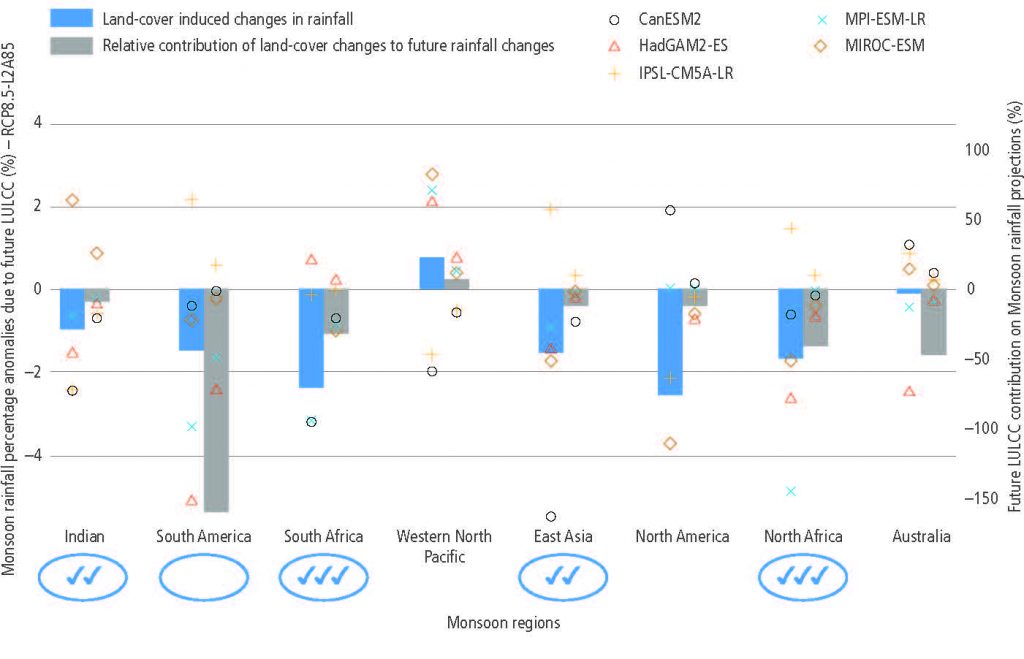
Figure 2.16
Changes in monsoon rainfall in RCP8.5 scenario resulting from projected changes in anthropogenic land cover, in eight monsoon regions (%, blue bars). Differences are calculated between the end of the 21st century (2071–2100) and the end of the 20th century (1976–2005), and the percent change is calculated with reference to 1976–2005. Grey bars refer to the relative contribution of land-cover changes (in %) to future rainfall projections: it is the ratio between the change in rainfall responding to land cover changes and the one responding to all anthropogenic changes (Quesada et al. 2017b). Negative values mean that changes in land cover have an opposite effect (dampening) on rainfall compared to the effects of all anthropogenic changes. Monsoon regions have been defined following Yim et al. (2014). The changes have been simulated by five climate models (Brovkin et al. 2013). Results are shown for December-January-February for southern hemisphere regions, and for June-July-August for northern hemisphere regions. Statistical significance is given by green tick marks and circles: one, two and three blue tick marks are displayed for the regions where at least 80% of the climate models have regional changes significant at the 66th, 75th and 80th confidence level, respectively; green circles are added when the regional values are also significant at 90th confidence level. Note that future land cover change impacts on South American monsoon are neither significant nor robust among models, along with very small future projected changes in South American monsoon rainfall.