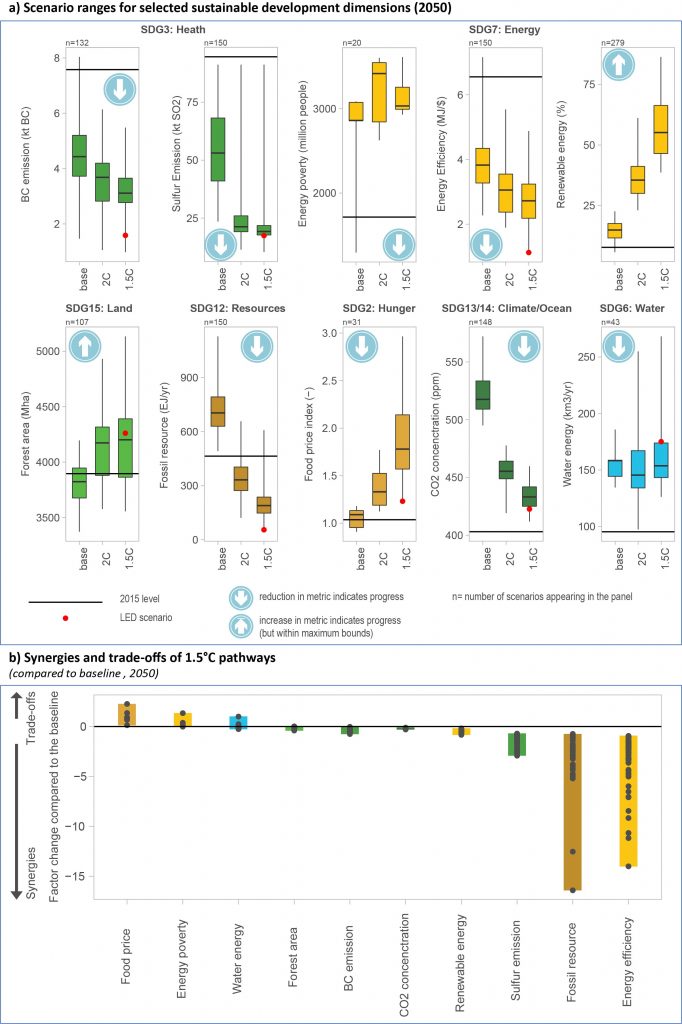
Figure 5.3
Sustainable development implications of mitigation actions in 1.5°C pathways.
Panel (a) shows ranges for 1.5°C pathways for selected sustainable development dimensions compared to the ranges of 2°C pathways and baseline pathways. The panel (a) depicts interquartile and the full range across the scenarios for Sustainable Development Goal (SDG) 2 (hunger), SDG 3 (health), SDG 6 (water), SDG 7 (energy), SDG 12 (resources), SDG 13/14 (climate/ocean) and SDG 15 (land). Progress towards achieving the SDGs is denoted by arrow symbols (increase or decrease of indicator). Black horizontal lines show 2015 values for comparison. Note that sustainable development effects are estimated for the effect of mitigation and do not include benefits from avoided impacts (see Chapter 3, Section 3.5). Low energy demand (LED) denotes estimates from a pathway with extremely low energy demand reaching 1.5°C without bioenergy with carbon capture and storage (BECCS). Panel (b) presents the resulting full range for synergies and trade-offs of 1.5°C pathways compared to the corresponding baseline scenarios. The y-axis in panel (b) indicates the factor change in the 1.5°C pathway compared to the baseline. Note that the figure shows gross impacts of mitigation and does not include feedbacks due to avoided impacts. The realization of the side effects will critically depend on local circumstances and implementation practice. Trade-offs across many sustainable development dimensions can be reduced through complementary/re-distributional measures. The figure is not comprehensive and focuses on those sustainable development dimensions for which quantifications across models are available. Sources: 1.5°C pathways database from Chapter 2 (Grubler et al., 2018; McCollum et al., 2018b).