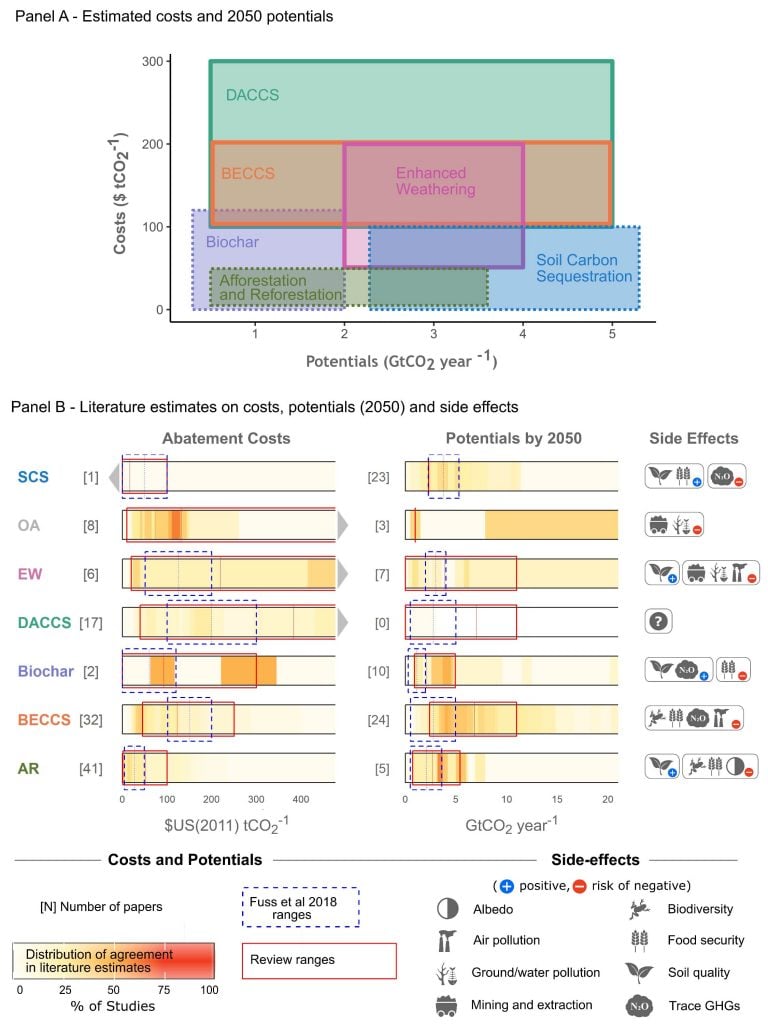
Evidence on carbon dioxide removal (CDR) abatement costs, 2050 deployment potentials, and key side effects.
Panel A presents estimates based on a systematic review of the bottom up literature (Fuss et al., 2018), corresponding to dashed blue boxes in Panel B. Dashed lines represent saturation limits for the corresponding technology. Panel B shows the percentage of papers at a given cost or potential estimate. Reference year for all potential estimates is 2050, while all cost estimates preceding 2050 have been included (as early as 2030, older estimates are excluded if they lack a base year and thus cannot be made comparable). Ranges have been trimmed to show detail (see Fuss et al., 2018 for the full range). Costs refer only to abatement costs. Icons for side-effects are allocated only if a critical mass of papers corroborates their occurrence
Notes: For references please see Supplementary Material Table 4.SM.3. Direct air carbon dioxide capture and storage (DACCS) is theoretically only constrained by geological storage capacity, estimates presented are considering upscaling and cost challenges (Nemet et al., 2018). BECCS potential estimates are based on bioenergy estimates in the literature (EJ yr−1), converted to GtCO2 following footnote 4. Potentials cannot be added up, as CDR options would compete for resources (e.g., land). SCS – soil carbon sequestration; OA – ocean alkalinization; EW- enhanced weathering; DACCS – direct air carbon dioxide capture and storage; BECCS – bioenergy with carbon capture and storage; AR – afforestation