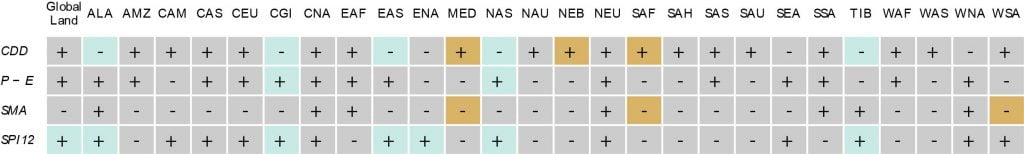
Significance of differences in regional drought and dryness indices between the 1.5°C and 2°C global mean temperature targets (rows).
Definition of indices: CDD: consecutive dry days; P–E: precipitation minus evapotranspiration; SMA: soil moisture anomalies; SPI12: 12-month Standarized Precipitation Index. Columns indicate analysed regions and global land (see Figure 3.2 for definitions). Significant differences are shown in light blue/brown shading (increases indicated with +, decreases indicated with –; light blue shading indicates decreases in dryness (decreases in CDD, or increases in P–E, SMA or SPI12) and light brown shading indicates increases in dryness (increases in CDD, or decreases in P–E, SMA or SPI12). Non—significant differences are shown in grey shading. The underlying methodology and the data basis are the same as for Figure 3.7 (see Supplementary Material 3.SM.2 for more details).