Figure 2.20
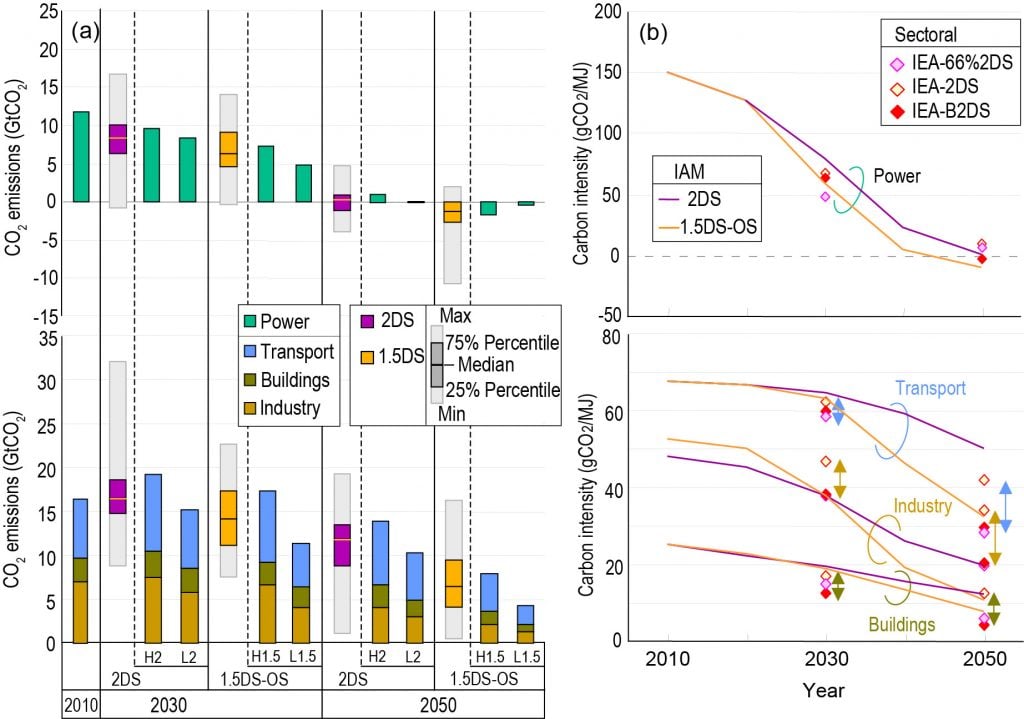
Comparison of (a) direct CO2 emissions and (b) carbon intensity of the power and energy end-use sectors (industry, buildings, and transport sectors) between IAMs and sectoral studies (IEA-ETP and IEA/IRENA).
Comparison of (a) direct CO2 emissions and (b) carbon intensity of the power and energy end-use sectors (industry, buildings, and transport sectors) between IAMs and sectoral studies (IEA-ETP and IEA/IRENA).
Original Creation for this Report using IAMC 1.5°C Scenario Data hosted by IIASA