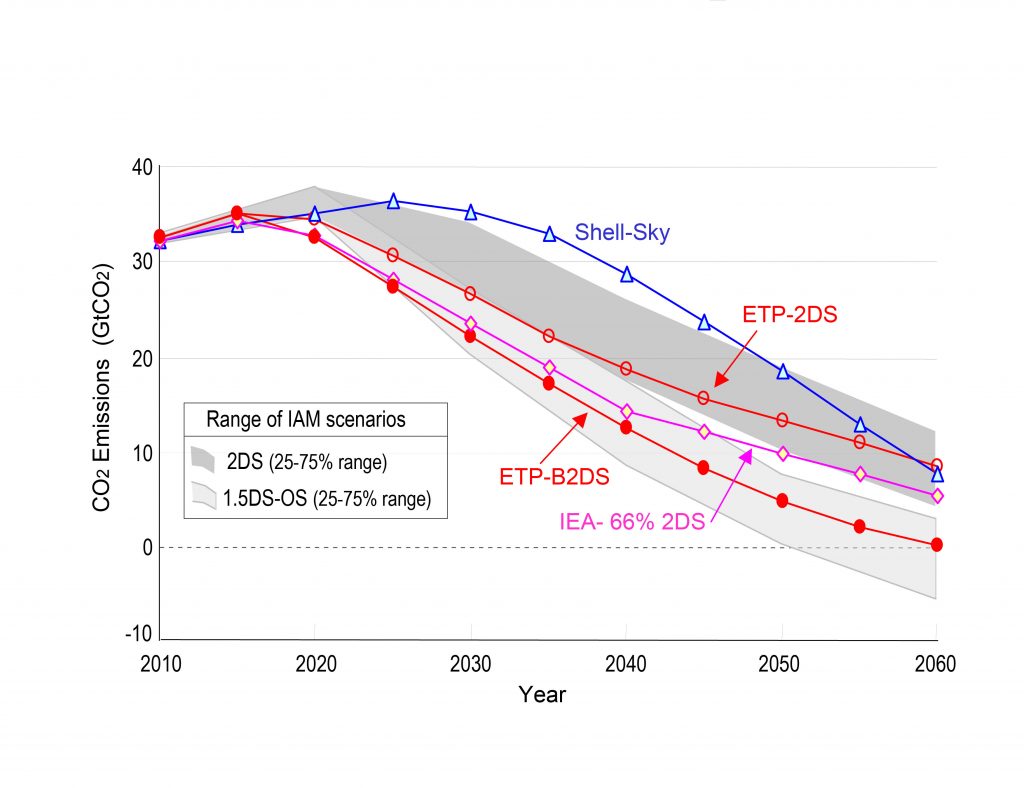
Figure 2.18
Comparison of CO2 emission trajectories of sectoral pathways (IEA ETP-B2DS, ETP-2DS, IEA-66%2DS, Shell-Sky) with the ranges of IAM pathway (2DS are 2°C-consistent pathways and 1.5DS-OS are1.5°C overshoot pathways). The CO2 emissions shown here are the energy-related emissions, including industrial process emissions.