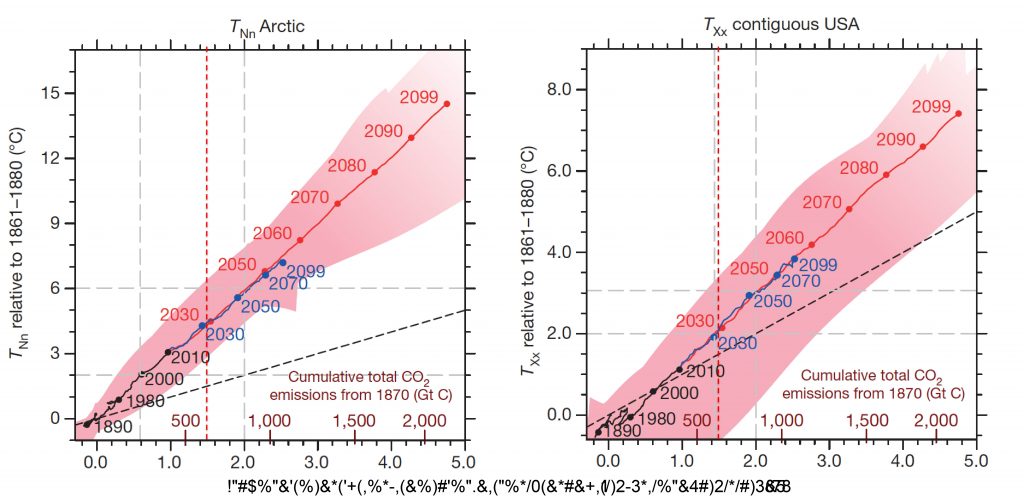
Spread of projected multimodel changes in minimum annual night-time temperature (TNn) in Arctic land (left) and in maximum annual daytime temperature (TXx) in the contiguous United States as a function of mean global warming in climate simulations.
The multimodel range (due to model spread and internal climate variability) is indicated in red shading (minimum and maximum value based on climate model simulations). The multimodel mean value is displayed with solid red and blue lines for two emissions pathways (blue: Representative Concentration Pathway (RCP)4.5; red: RCP8.5). The dashed red line indicates projections for a 1.5°C warmer world. The dashed black line displays the 1:1 line. The figure is based on Figure 3 of Seneviratne et al. (2016).