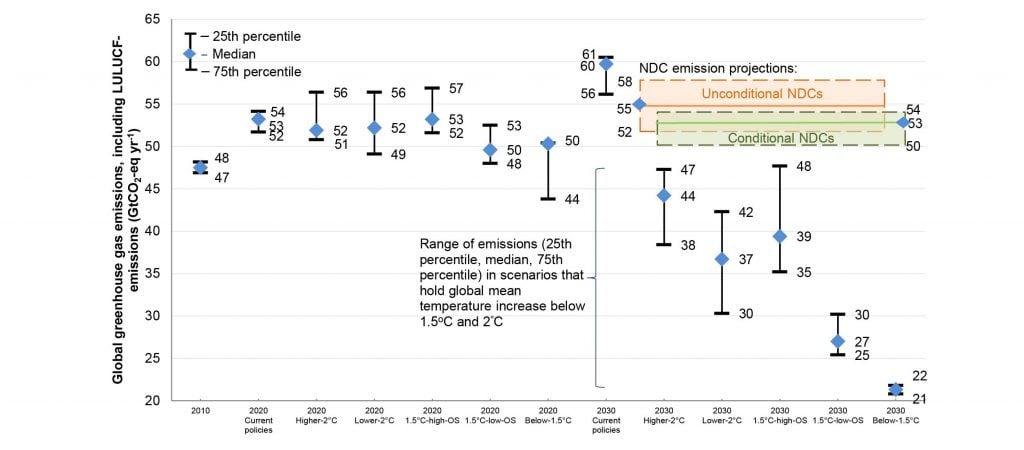
Cross-Chapter Box 11. Figure 1
GHG emissions are all expressed in units of CO2-equivalence computed with 100-year global warming potentials (GWPs) reported in IPCC SAR, while the emissions for the 1.5°C and 2°C scenarios in Table 2.4 are reported using the 100-year GWPs reported in IPCC AR4, and are hence about 3% higher.