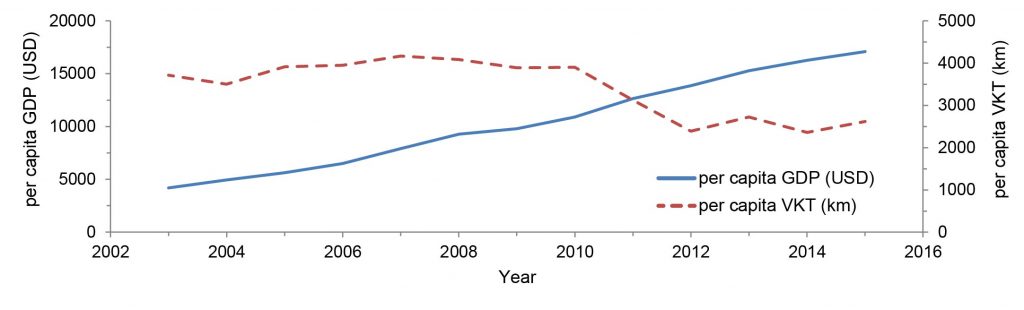
Box 4.9. Figure 2
Peak car in Beijing: relationships between economic performance and private automobile use in Beijing from 1986 to 2014.
Peak car in Beijing: relationships between economic performance and private automobile use in Beijing from 1986 to 2014.