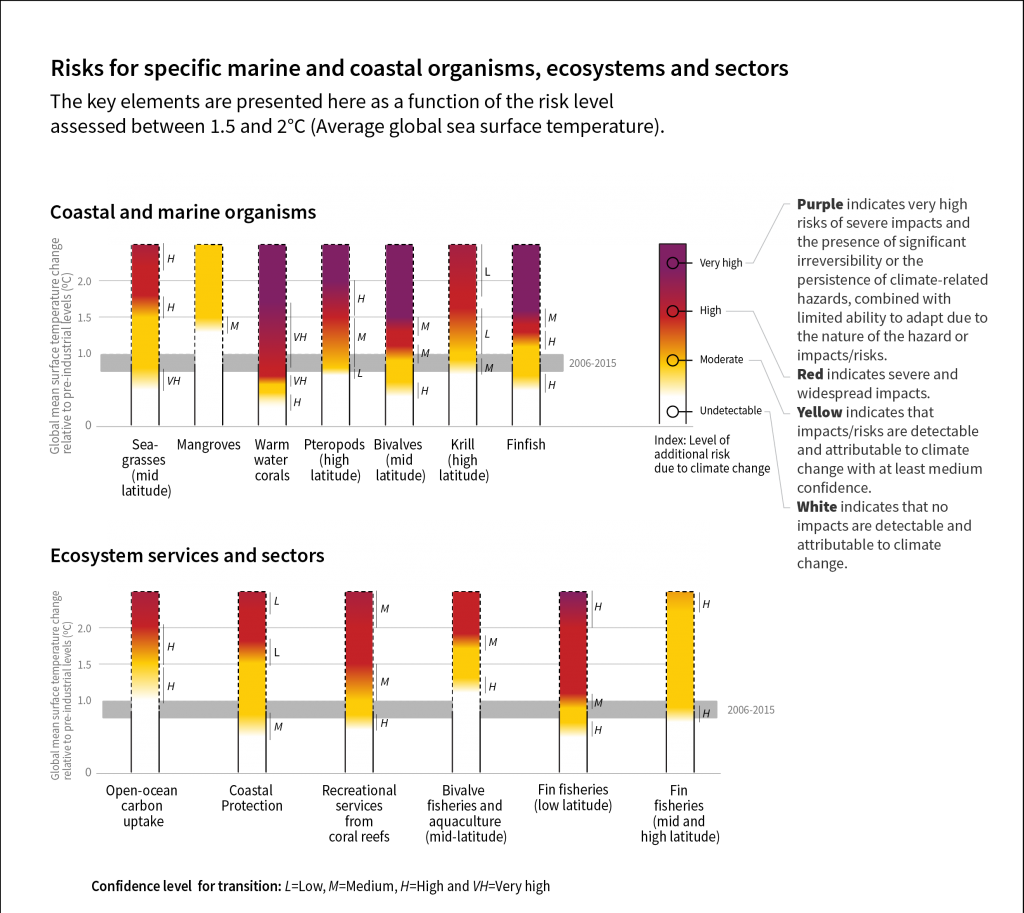
Summary of additional risks of impacts from ocean warming (and associated climate change factors such ocean acidification) for a range of ocean organisms, ecosystems and sectors at 1.0°C, 1.5°C and 2.0°C of warming of the average sea surface temperature (SST) relative to the pre-industrial period.
The grey bar represents the range of GMST for the most recent decade: 2006–2015. The assessment of changing risk levels and associated confidence were primarily derived from the expert judgement of Gattuso et al. (2015) and the lead authors and relevant contributing authors of Chapter 3 (SR1.5), while additional input was received from the many reviewers of the ocean systems section of SR1.5. Notes: (i) The analysis shown here is not intended to be comprehensive. The examples of organisms, ecosystems and sectors included here are intended to illustrate the scale, types and projection of risks for representative natural and human ocean systems. (ii) The evaluation of risks by experts did not consider genetic adaptation, acclimatization or human risk reduction strategies (mitigation and societal adaptation). (iii) As discussed elsewhere (Sections 3.3.10 and 3.4.4.5, Box 3.4; Gattuso et al., 2015), ocean acidification is also having impacts on organisms and ecosystems as carbon dioxide increases in the atmosphere. These changes are part of the responses reported here, although partitioning the effects of the two drivers is difficult at this point in time and hence was not attempted. (iv) Confidence levels for location of transition points between levels of risk (L = low, M = moderate, H = high and VH = very high) are assessed and presented here as in the accompanying study by Gattuso et al. (2015). Three transitions in risk were possible: W–Y (white to yellow), Y–R (yellow to red), and R–P (red to purple), with the colours corresponding to the level of additional risk posed by climate change. The confidence levels for these transitions were assessed, based on level of agreement and extent of evidence, and appear as letters associated with each transition (see key in diagram).