Figure 3.8
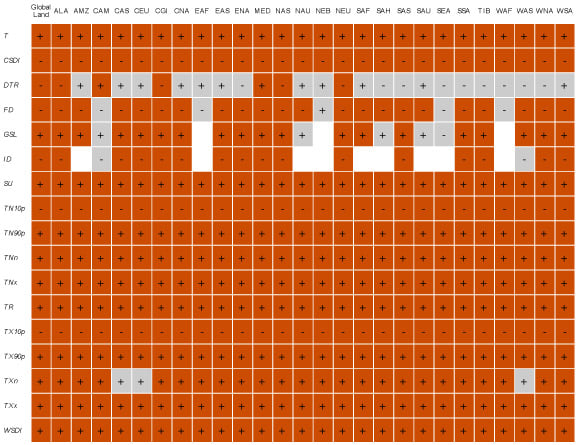
Significance of differences in regional mean temperature and range of temperature indices between the 1.5°C and 2°C global mean temperature targets (rows).

Significance of differences in regional mean temperature and range of temperature indices between the 1.5°C and 2°C global mean temperature targets (rows).
Definitions of indices: T: mean temperature; CSDI: cold spell duration index; DTR: diurnal temperature range; FD: frost days; GSL: growing season length; ID: ice days; SU: summer days; TN10p: proportion of days with a minimum temperature (TN) lower than the 10th percentile of TN; TN90p: proportion of days with TN higher than the 90th percentile of TN; TNn: minimum yearly value of TN; TNx: maximum yearly value of TN; TR: tropical nights; TX10p: proportion of days with a maximum temperature (TX) lower than the 10th percentile of TX; TX90p: proportion of days with TX higher than the 90th percentile of TX; TXn: minimum yearly value of TX; TXx: maximum yearly value of TX; WSDI: warm spell duration index. Columns indicate analysed regions and global land (see Figure 3.2 for definitions). Significant differences are shown in red shading, with increases indicated with + and decreases indicated with –, while non-significant differences are shown in grey shading. White shading indicates when an index is the same at the two global warming levels (i.e., zero changes). Note that decreases in CSDI, FD, ID, TN10p and TX10p are linked to increased temperatures on cold days or nights. Significance was tested using a two-sided paired Wilcoxon test (P=0.01, after controlling the false discovery rate according to Benjamini and Hochberg, 1995) (adapted from Wartenburger et al., 2017).
Original Creation for this Report using CMIP5 multi-model ensemble output data.