Figure TS.7
Figure caption
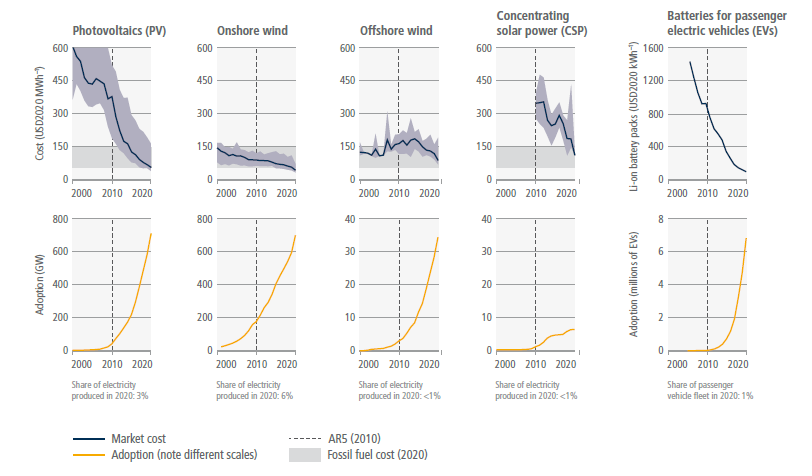
Figure TS.7 | The unit costs of batteries and some forms of renewable energy have fallen significantly, and their adoption continues to increase. The top panel shows global costs per unit of energy (USD per MWh) for some rapidly changing mitigation technologies. Solid blue lines indicate average unit cost in each year. Light blue shaded areas show the range between the 5th and 95th percentiles in each year. Grey shading indicates the range of unit costs for new fossil fuel (coal and gas) power in 2020 (corresponding to USD55–148 per MWh). In 2020, the levelised costs of energy (LCOE) of the four renewable energy technologies could compete with fossil fuels in many places. For batteries, costs shown are for 1 kWh of battery storage capacity; for the others, costs are LCOE, which includes installation, capital, operations, and maintenance costs per MWh of electricity produced. The literature uses LCOE because it allows consistent comparisons of cost trends across a diverse set of energy technologies to be made. However, it does not include the costs of grid integration or climate impacts. Further, LCOE does not take into account other environmental and social externalities that may modify the overall (monetary and non-monetary) costs of technologies and alter their deployment. The bottom panel shows cumulative global adoption for each technology, in GW of installed capacity for renewable energy and in millions of vehicles for battery-electric vehicles. A vertical dashed line is placed in 2010 to indicate the change since AR5. Shares of electricity produced and share of passenger vehicle fleet are indicated in text for 2020 based on provisional data, i.e., percentage of total electricity production (for PV, onshore wind, offshore wind, CSP) and of total stock of passenger vehicles (for EVs). The electricity production share reflects different capacity factors; for example, for the same amount of installed capacity, wind produces about twice as much electricity as solar PV. {2.5, 6.4} Renewable energy and battery technologies were selected as illustrative examples because they have recently shown rapid changes in costs and adoption, and because consistent data are available. Other mitigation options assessed in the report are not included as they do not meet these criteria.
