Figure: SPM.4
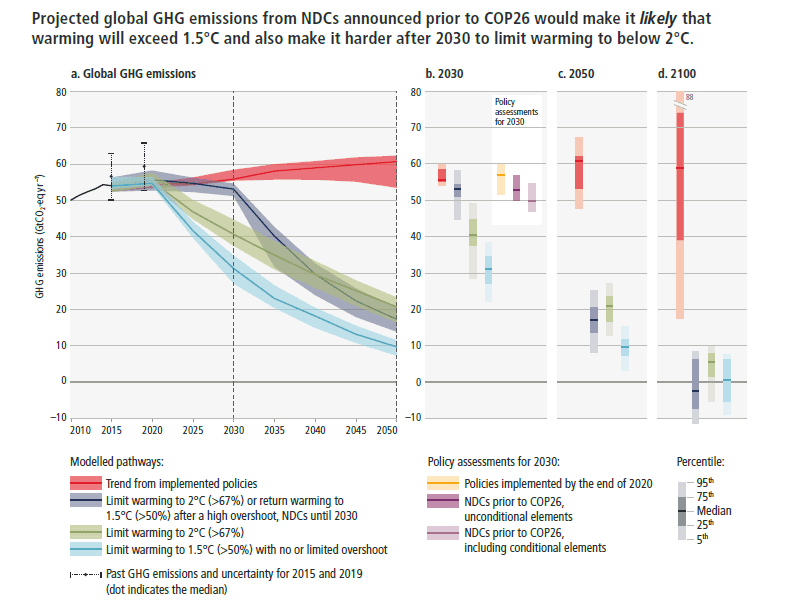
Figure SPM.4: Global GHG emissions of modelled pathways (funnels in Panel a. and associated bars in Panels b, c, d) and projected emission outcomes from near-term policy assessments for 2030 (Panel b).Panel a shows global GHG emissions over 2015-2050 for four types of assessed modelled global pathways:
- Trend from implemented policies: Pathways with projected near-term GHG emissions in line with policies implemented until the end of 2020 and extended with comparable ambition levels beyond 2030 (29 scenarios across categories C5-C7, Table SPM.1)
- Limit to 2°C (>67%) or return warming to 1.5°C (>50%) after a high overshoot, NDCs until 2030: Pathways with GHG emissions until 2030 associated with the implementation of NDCs announced prior to COP26, followed by accelerated emissions reductions likely to limit warming to 2°C (C3b, Table SPM.1) or to return warming to 1.5°C with a probability of 50% or greater after high overshoot (subset of 42 scenarios from C2, Table SPM.1).
- Limit to 2°C (>67%) with immediate action: Pathways that limit warming to 2°C (>67%) with immediate action after 202021 (C3a, Table SPM.1).
- Limit to 1.5°C (>50%) with no or limited overshoot: Pathways limiting warming to 1.5°C with no or limited overshoot (C1, Table SPM.1 C1). All these pathways assume immediate action after 2020.
Past GHG emissions for 2010-2015 used to project global warming outcomes of the modelled pathways are shown by a black line25 and past global GHG emissions in 2015 and 2019 as assessed in Chapter 2 are shown by whiskers.
FOOTNOTE 25: See the Box SPM.1 for a description of the approach to project global warming outcomes of modelled pathways and its consistency between the climate assessment in AR6 WG I.
Panels b, c and d show snapshots of the GHG emission ranges of the modelled pathways in 2030, 2050, and 2100, respectively. Panel b also shows projected emissions outcomes from near-term policy assessments in 2030 from Chapter 4.2 (Tables 4.2 and 4.3; median and full range). GHG emissions are in CO2-equivalent using GWP100 from AR6 WG I. {3.5, 4.2, Tables 4.2 and 4.3, Cross-Chapter Box 4 in Chapter 4}
