Figure 7.16
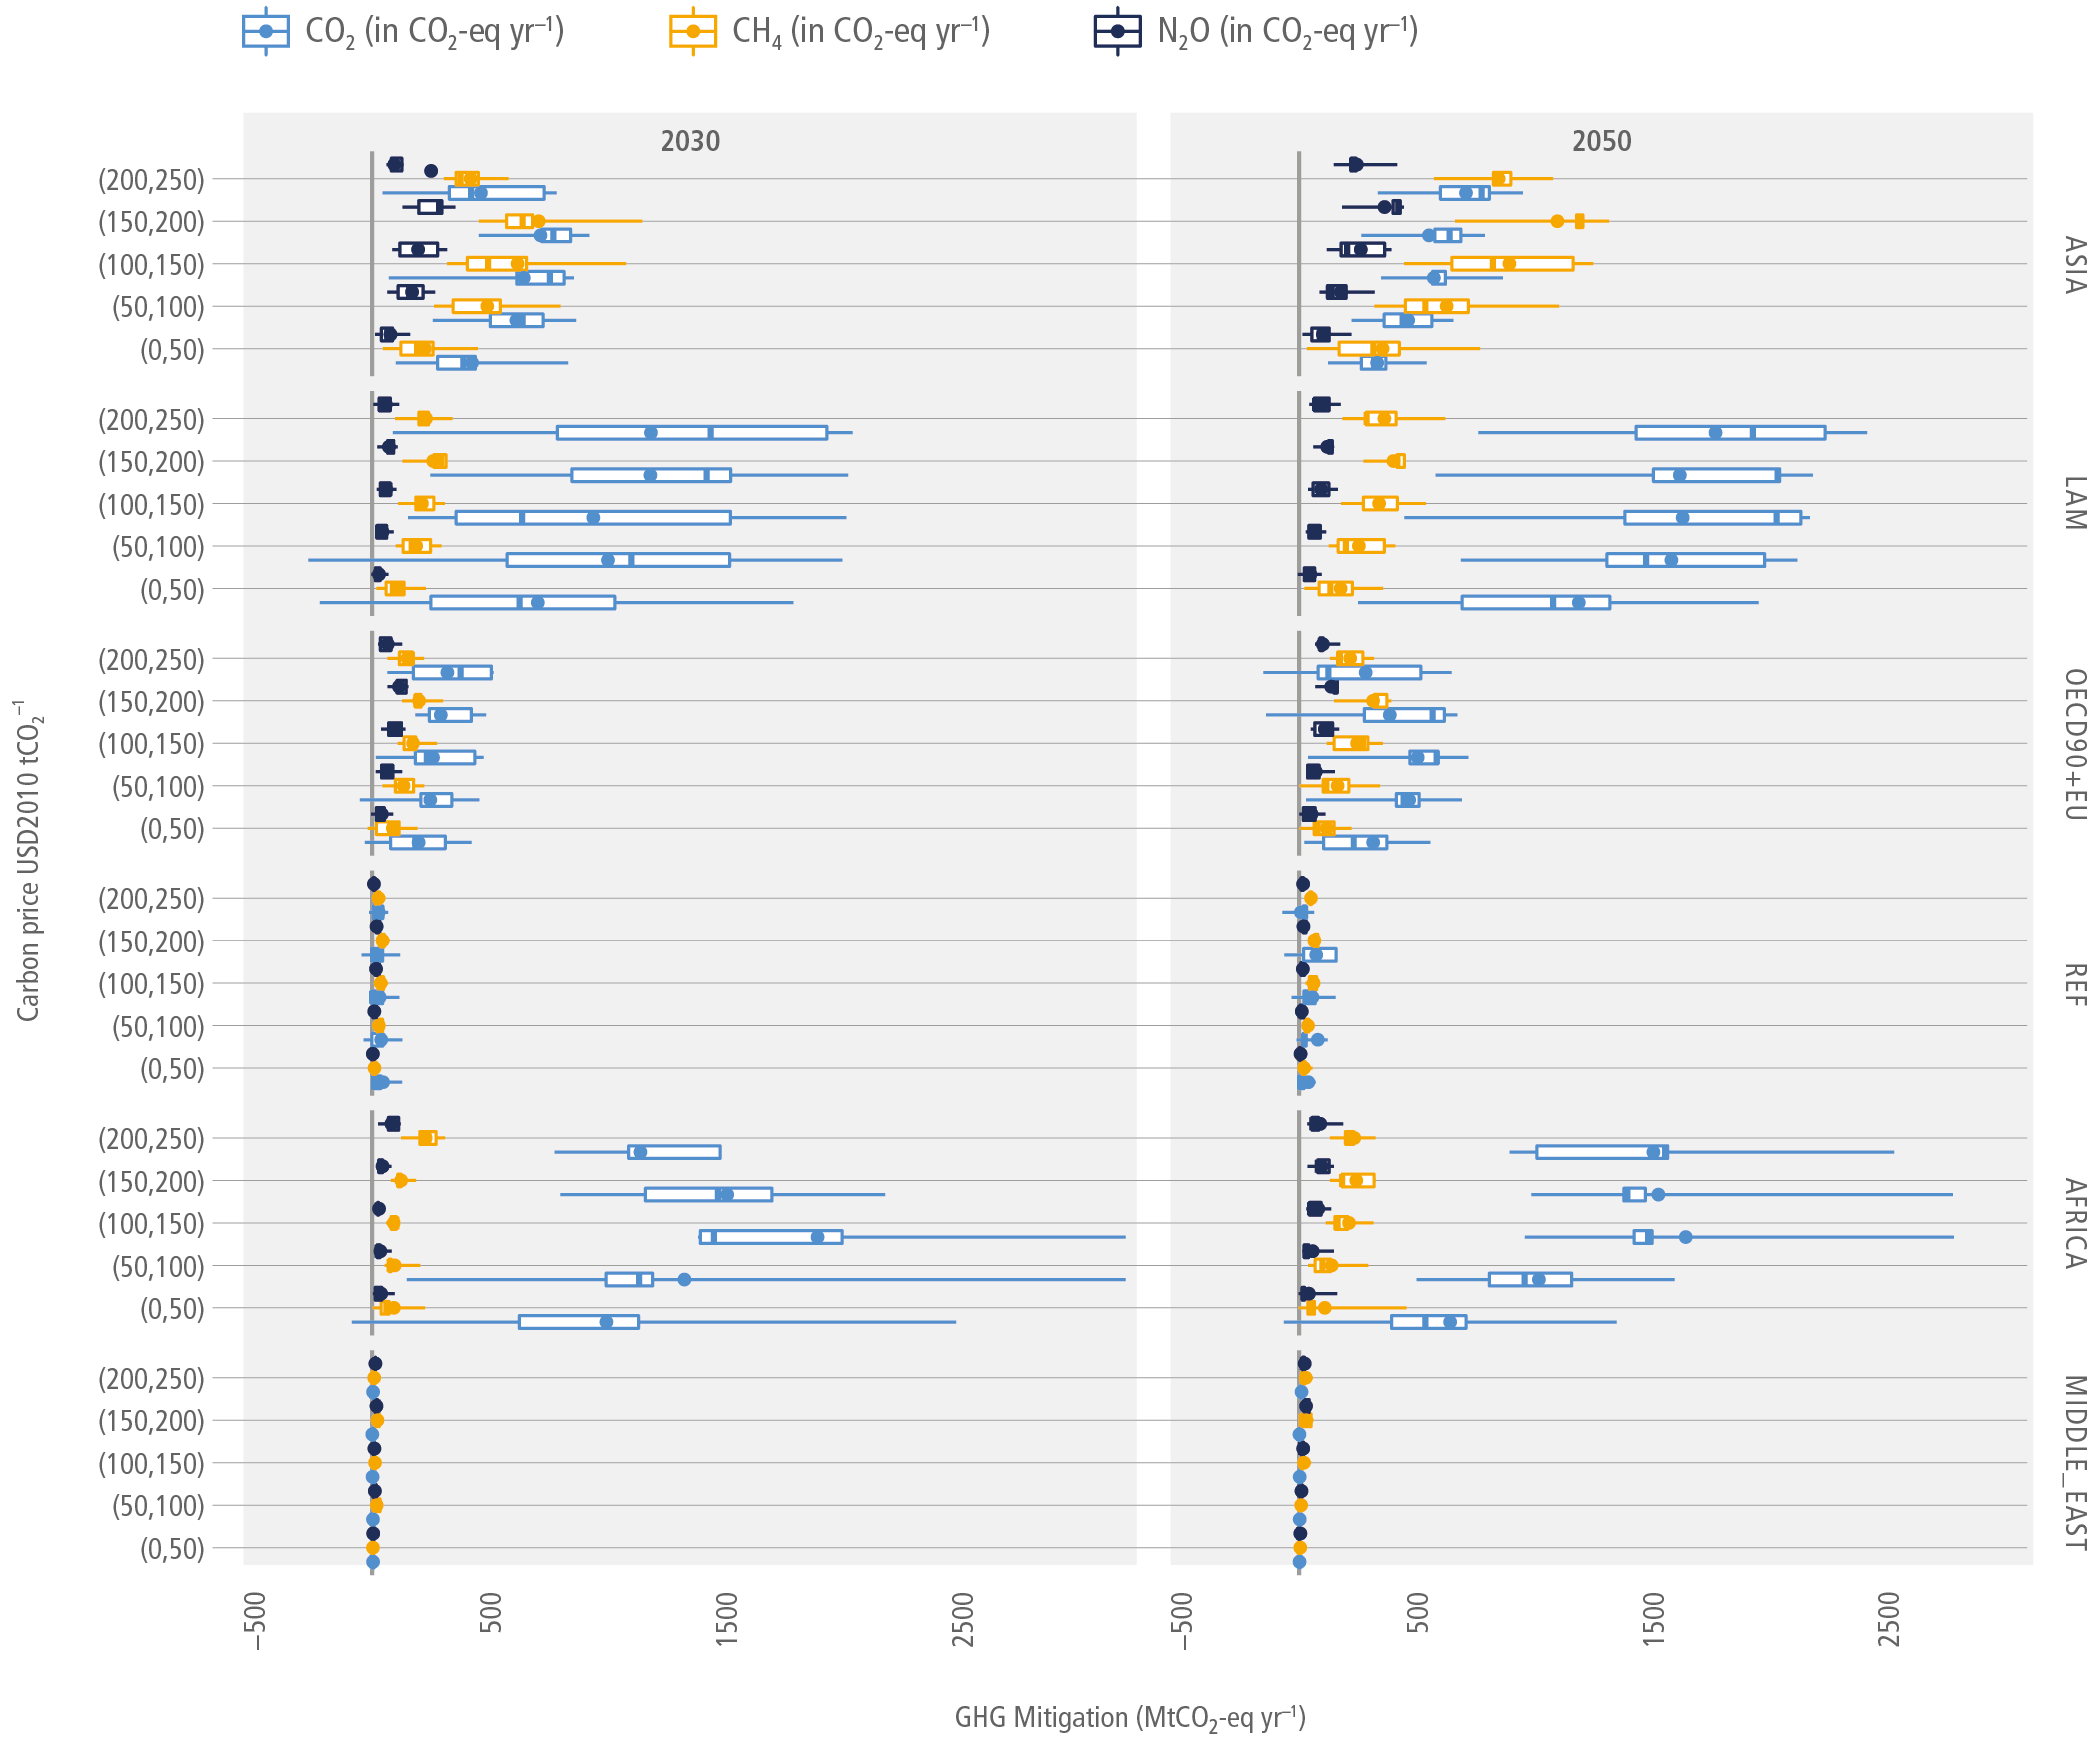
Figure caption
Figure 7.16 | Regional mitigation efforts for CO2, CH4 and N2O emissions (in CO2-eq yr–1 using IPCC AR6 GWP100 values) from the AFOLU sector for increasing carbon price levels for 2030 and 2050. Underlying datapoints are generated by comparing emissions between a policy scenario and a related benchmark scenario, mapping these differences with the respective carbon price differences. Boxplots show Medians (vertical line within the boxes), Means (dots), 33%–66% intervals (box) and 10%–90% intervals (horizontal lines) for respective scenarios of carbon prices implemented in intervals of USD50 from a price of USD0 to USD250. Regions: Asia (ASIA), Latin America and Caribbean (LAM), Middle East (MIDDLE_EAST), Africa (AFRICA), Developed Countries (OECD 90 and EU) (OECD+EU) and Reforming Economies of Eastern Europe and the Former Soviet Union (REF).