Figure 2.21
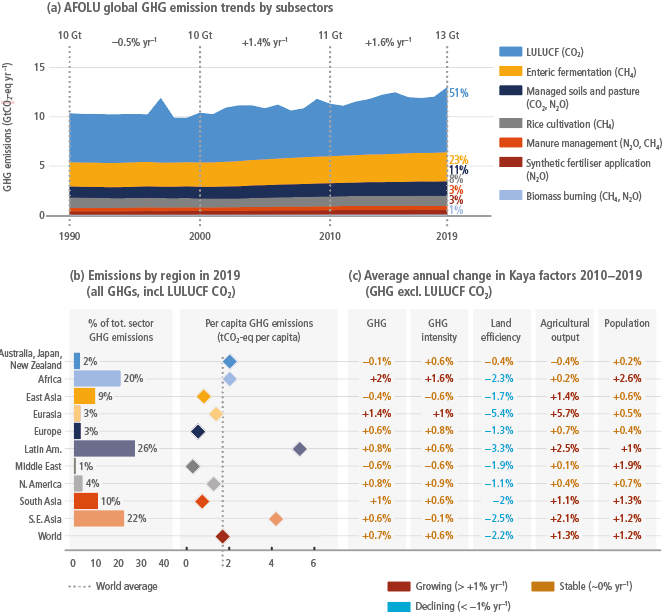
Figure caption
Figure 2.21 | Trends and drivers of global AFOLU sector emissions: (a) trends of GHG emissions by subsectors 1990–2019; (b) share of total sector and per capita GHG emissions by world region in 2019; and (c) Kaya decomposition of GHG emissions drivers. Based on the equation H=P(A/P)(L/A)(H/L), where P is population, A/P is agricultural output per capita, L/A is the land required per unit of agricultural output (land efficiency), and H/L is GHG emissions per unit of land (GHG intensity) (Hong et al. 2021). GHG emissions H comprise agricultural CH4 and N2O emissions from EDGAR v6.0. The indicated annual growth rates are averaged across the years 2010–2019 – LULUCF CO2 emissions are excluded in panel (c). (Note: due to different datasets, the population breakdown for AFOLU emissions is slightly different than that in the other sector figures above).
