Back to chapter figures
Figure 15.6
Figure caption
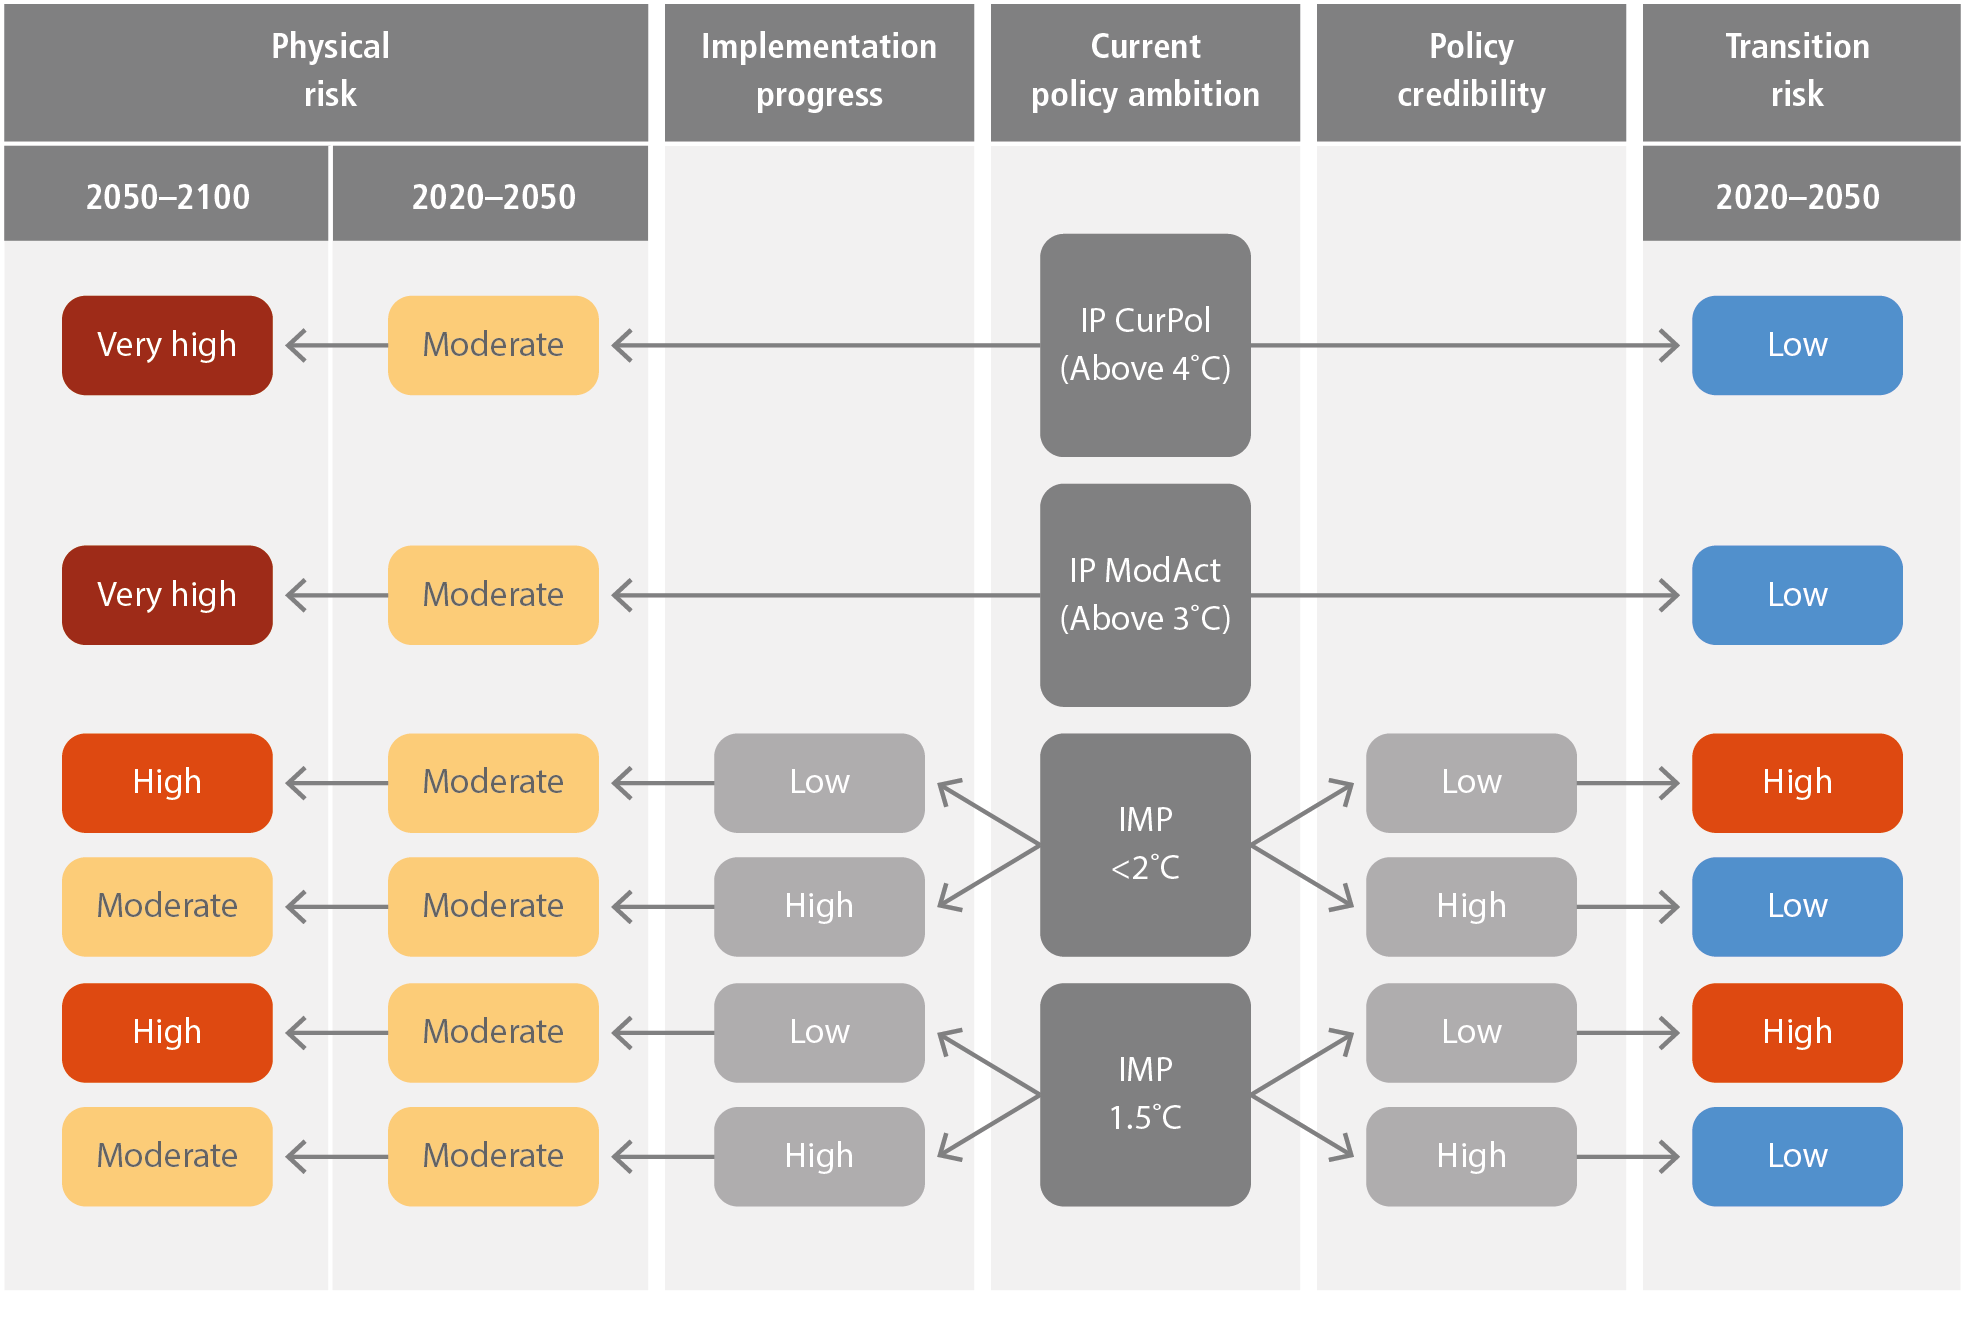
Figure 15.6 | Schematic representation of climate scenarios in terms of both physical and transition risk. While the figure does not cover all possible events, it maps out how the combination of stated targets can lead to different paths in terms of risk, depending on implementation progress and policy credibility. IMP 1.5°C and IMP <2°C are representative for IMP-GS (Sens. Neg; Ren), IMP-Neg, IMP-LD; IMP-Ren; IMP-SP. Note that the figure defines ‘High’ progress as higher, but it is important that the physical risk varies by region and country. This means, that ‘Moderate’ physical risk can be significant and even hardly absorbable for some countries.
