Back to chapter figures
Figure 12.3
Figure caption
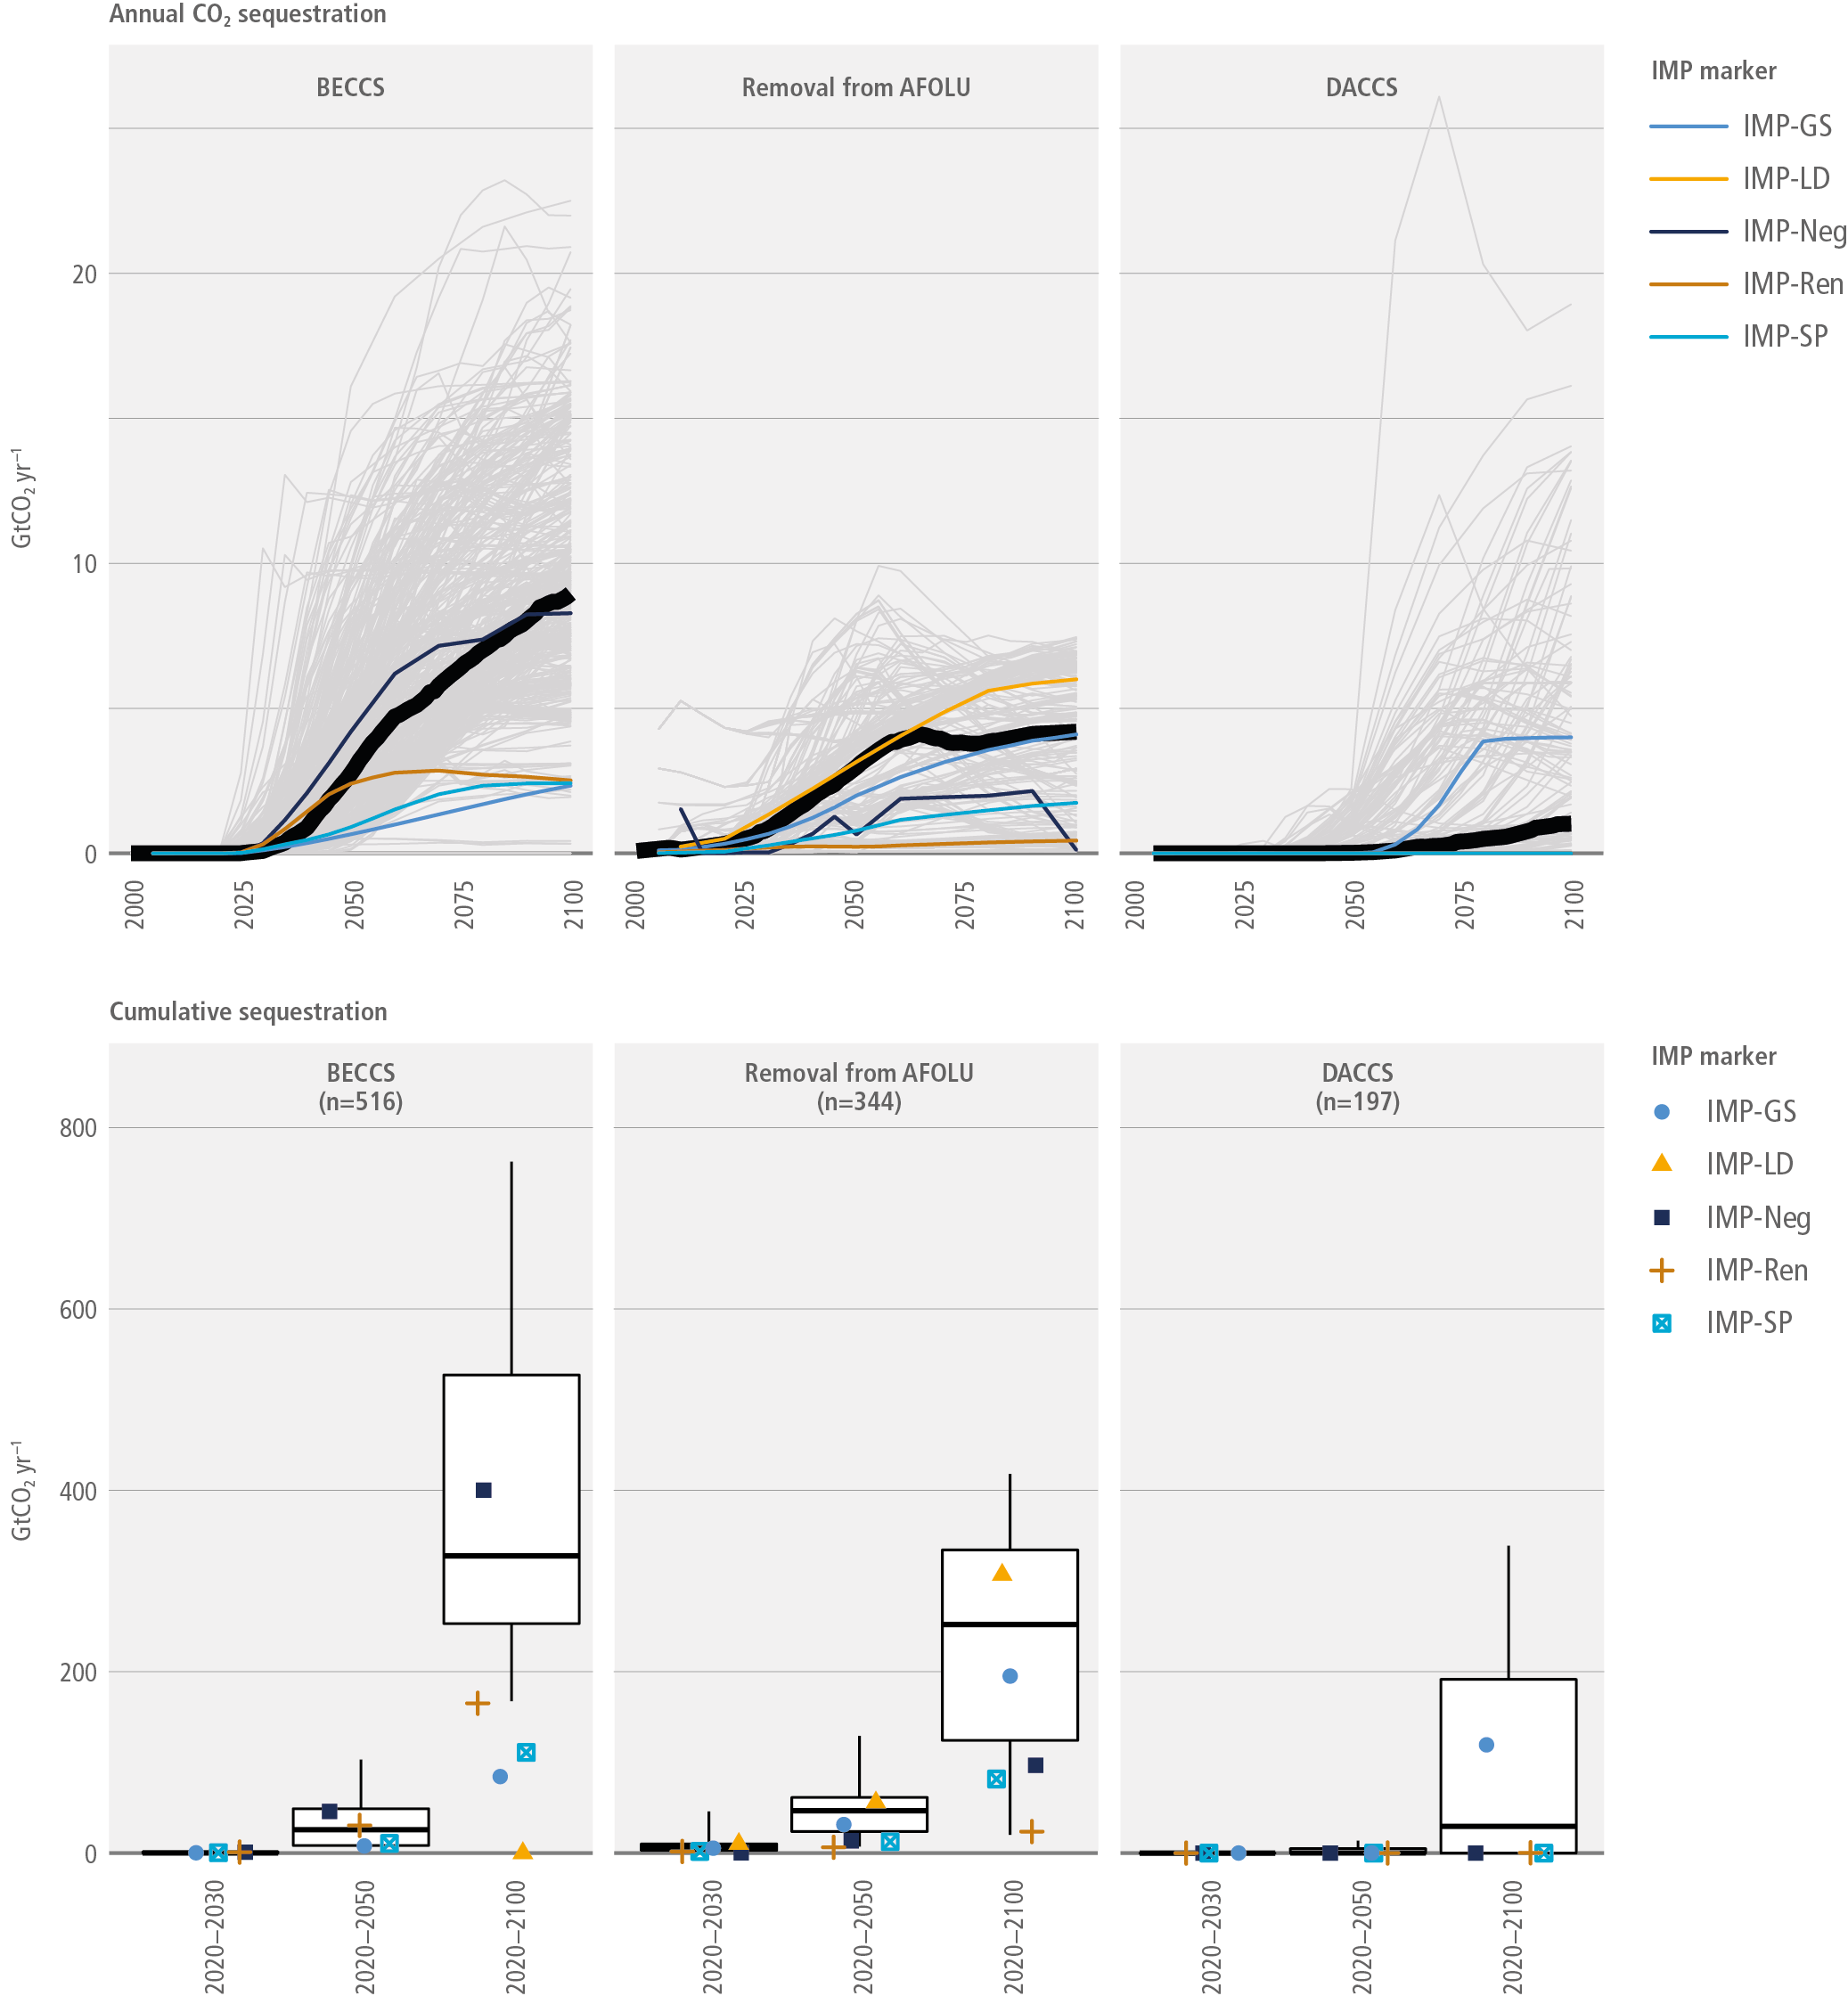
Figure 12.3 | Sequestration through three predominant CDR methods: BECCS, CO2 removal from AFOLU (mainly A/R), and DACCS (upper panels) annual sequestration and (lower panels) cumulative sequestration. The IAM scenarios described in the figure correspond to those that limit warming to 2°C (>67%) or lower. The black line in each of the upper panels indicates the median of all the scenarios in categories C1 to C3. Hinges in the lower panels represent the interquartile ranges while whiskers extend to 5th and 95th percentiles. The IMPs are highlighted with colours, as shown in the key. The number of scenarios is indicated in the header of each panel. The number of scenarios with a non-zero DACCS value is 146.
