Back to chapter figures
Figure 10.18
Figure caption
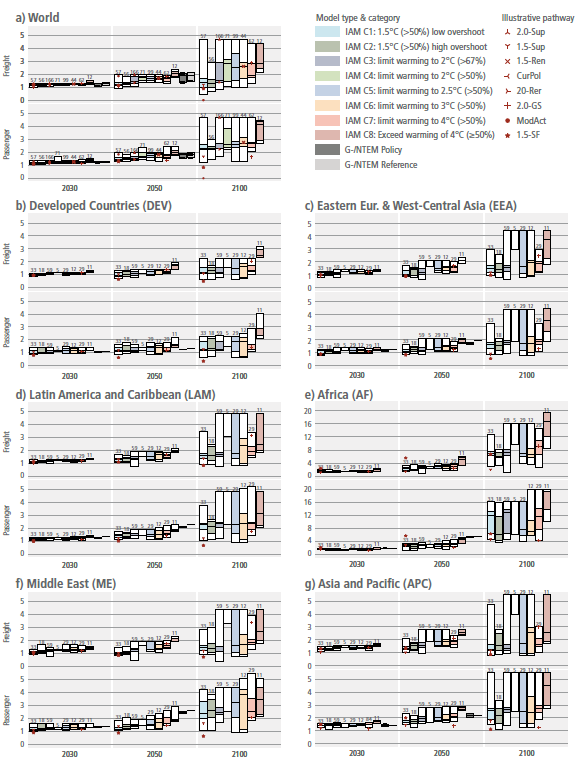
Figure 10.18 | Transport activity trajectories for passenger (bottom panel) and freight (top panel) in 2030, 2050, and 2100 indexed to 2020 modelled year across R6 Regions and World. Plots show 5–95th percentile, 25–75th percentile, and median. Numbers above the bars indicate the number of scenarios. Data from the AR6 scenario database.
