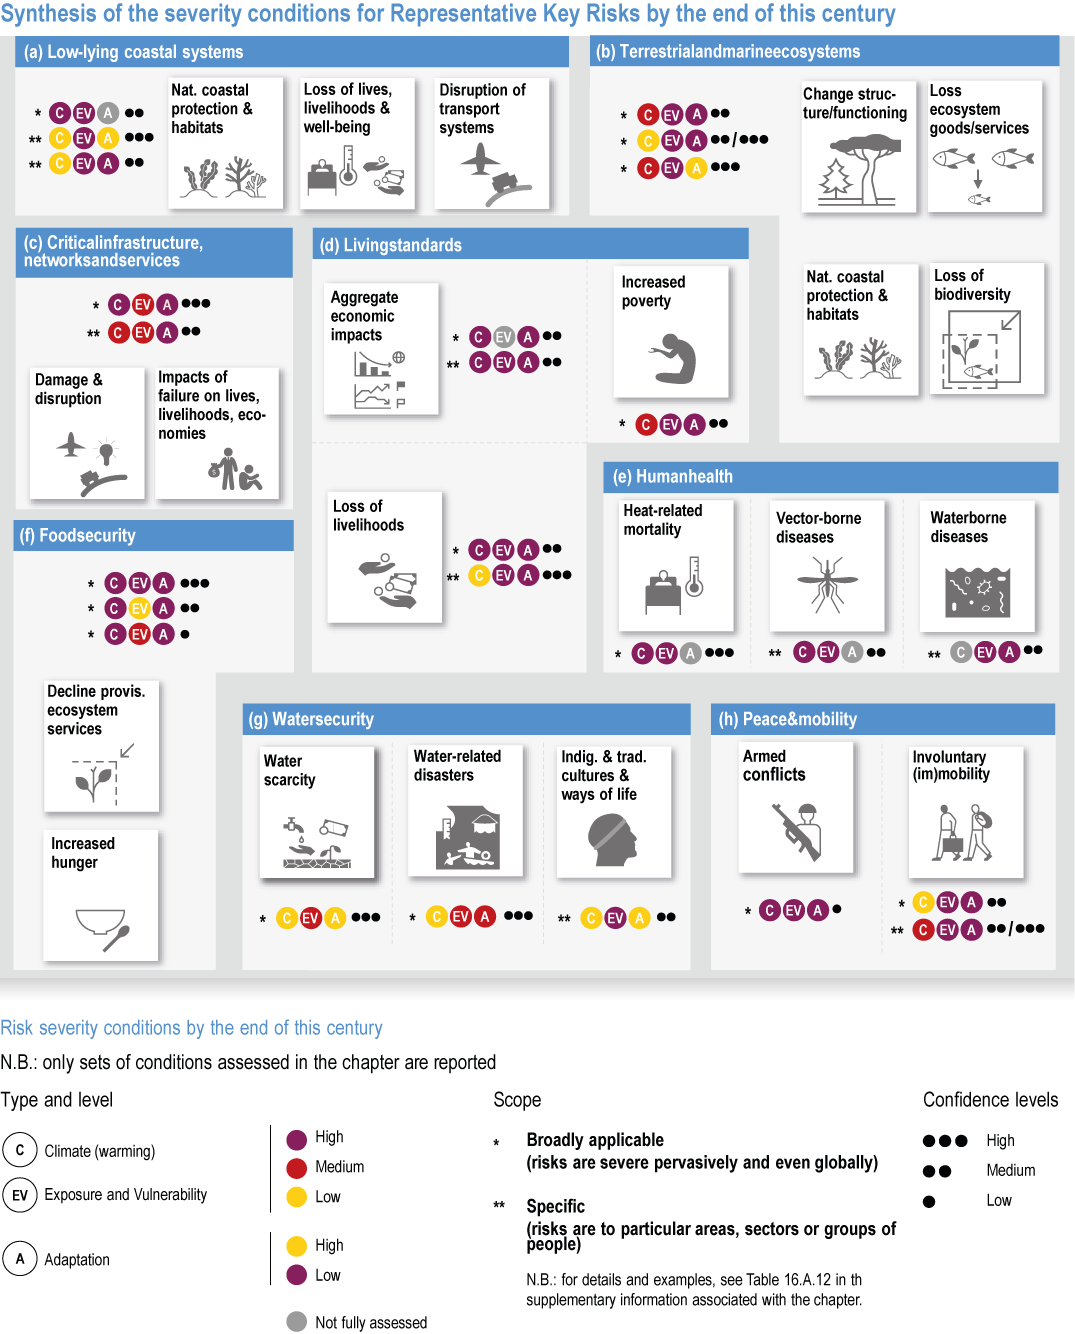
Figure TS.AII.1
Figure caption
Figure TS.AII.1 | Synthesis of the severity conditions for Representative Key Risks (RKRs) by the end of this century. The figure does not aim to describe severity conditions exhaustively for each RKR, but rather to illustrate the risks highlighted in this report (Sections 16.5.2.3.1 to 16.5.2.3.8). Coloured circles represent the levels of warming (climate), exposure/vulnerability and adaptation that would lead to severe risks for particular key risks and RKRs. Each set of three circles represents a combination of conditions that would lead to severe risk with a particular level of confidence, indicated by the number of black dots to the right of the set, and for a particular scope, indicated by the number of stars to the left of the set. The two scopes are ‘broadly applicable’, meaning applicable pervasively and even globally, and ‘specific’, meaning applicable to particular areas, sectors or groups of people. Details of confidence levels and scopes can be found in Section 16.5.2.3. In terms of severity condition levels (Section 16.5.2.3), for warming levels (coloured circles labelled ‘C’ in the figure), high refers to climate outcomes consistent with RCP8.5 or higher, low refers to climate outcomes consistent with RCP2.6 or lower, and medium refers to intermediary climate scenarios. Exposure-vulnerability levels are determined relative to the range of future conditions considered in the literature. For adaptation, high refers to near maximum potential and low refers to the continuation of today’s trends. Despite being intertwined in reality, exposure-vulnerability and adaptation conditions are distinguished to help understand their respective contributions to risk severity. {`{`}Figure 16.10{`}`}
