Back chapter figures
Figure SPM.3
Figure caption
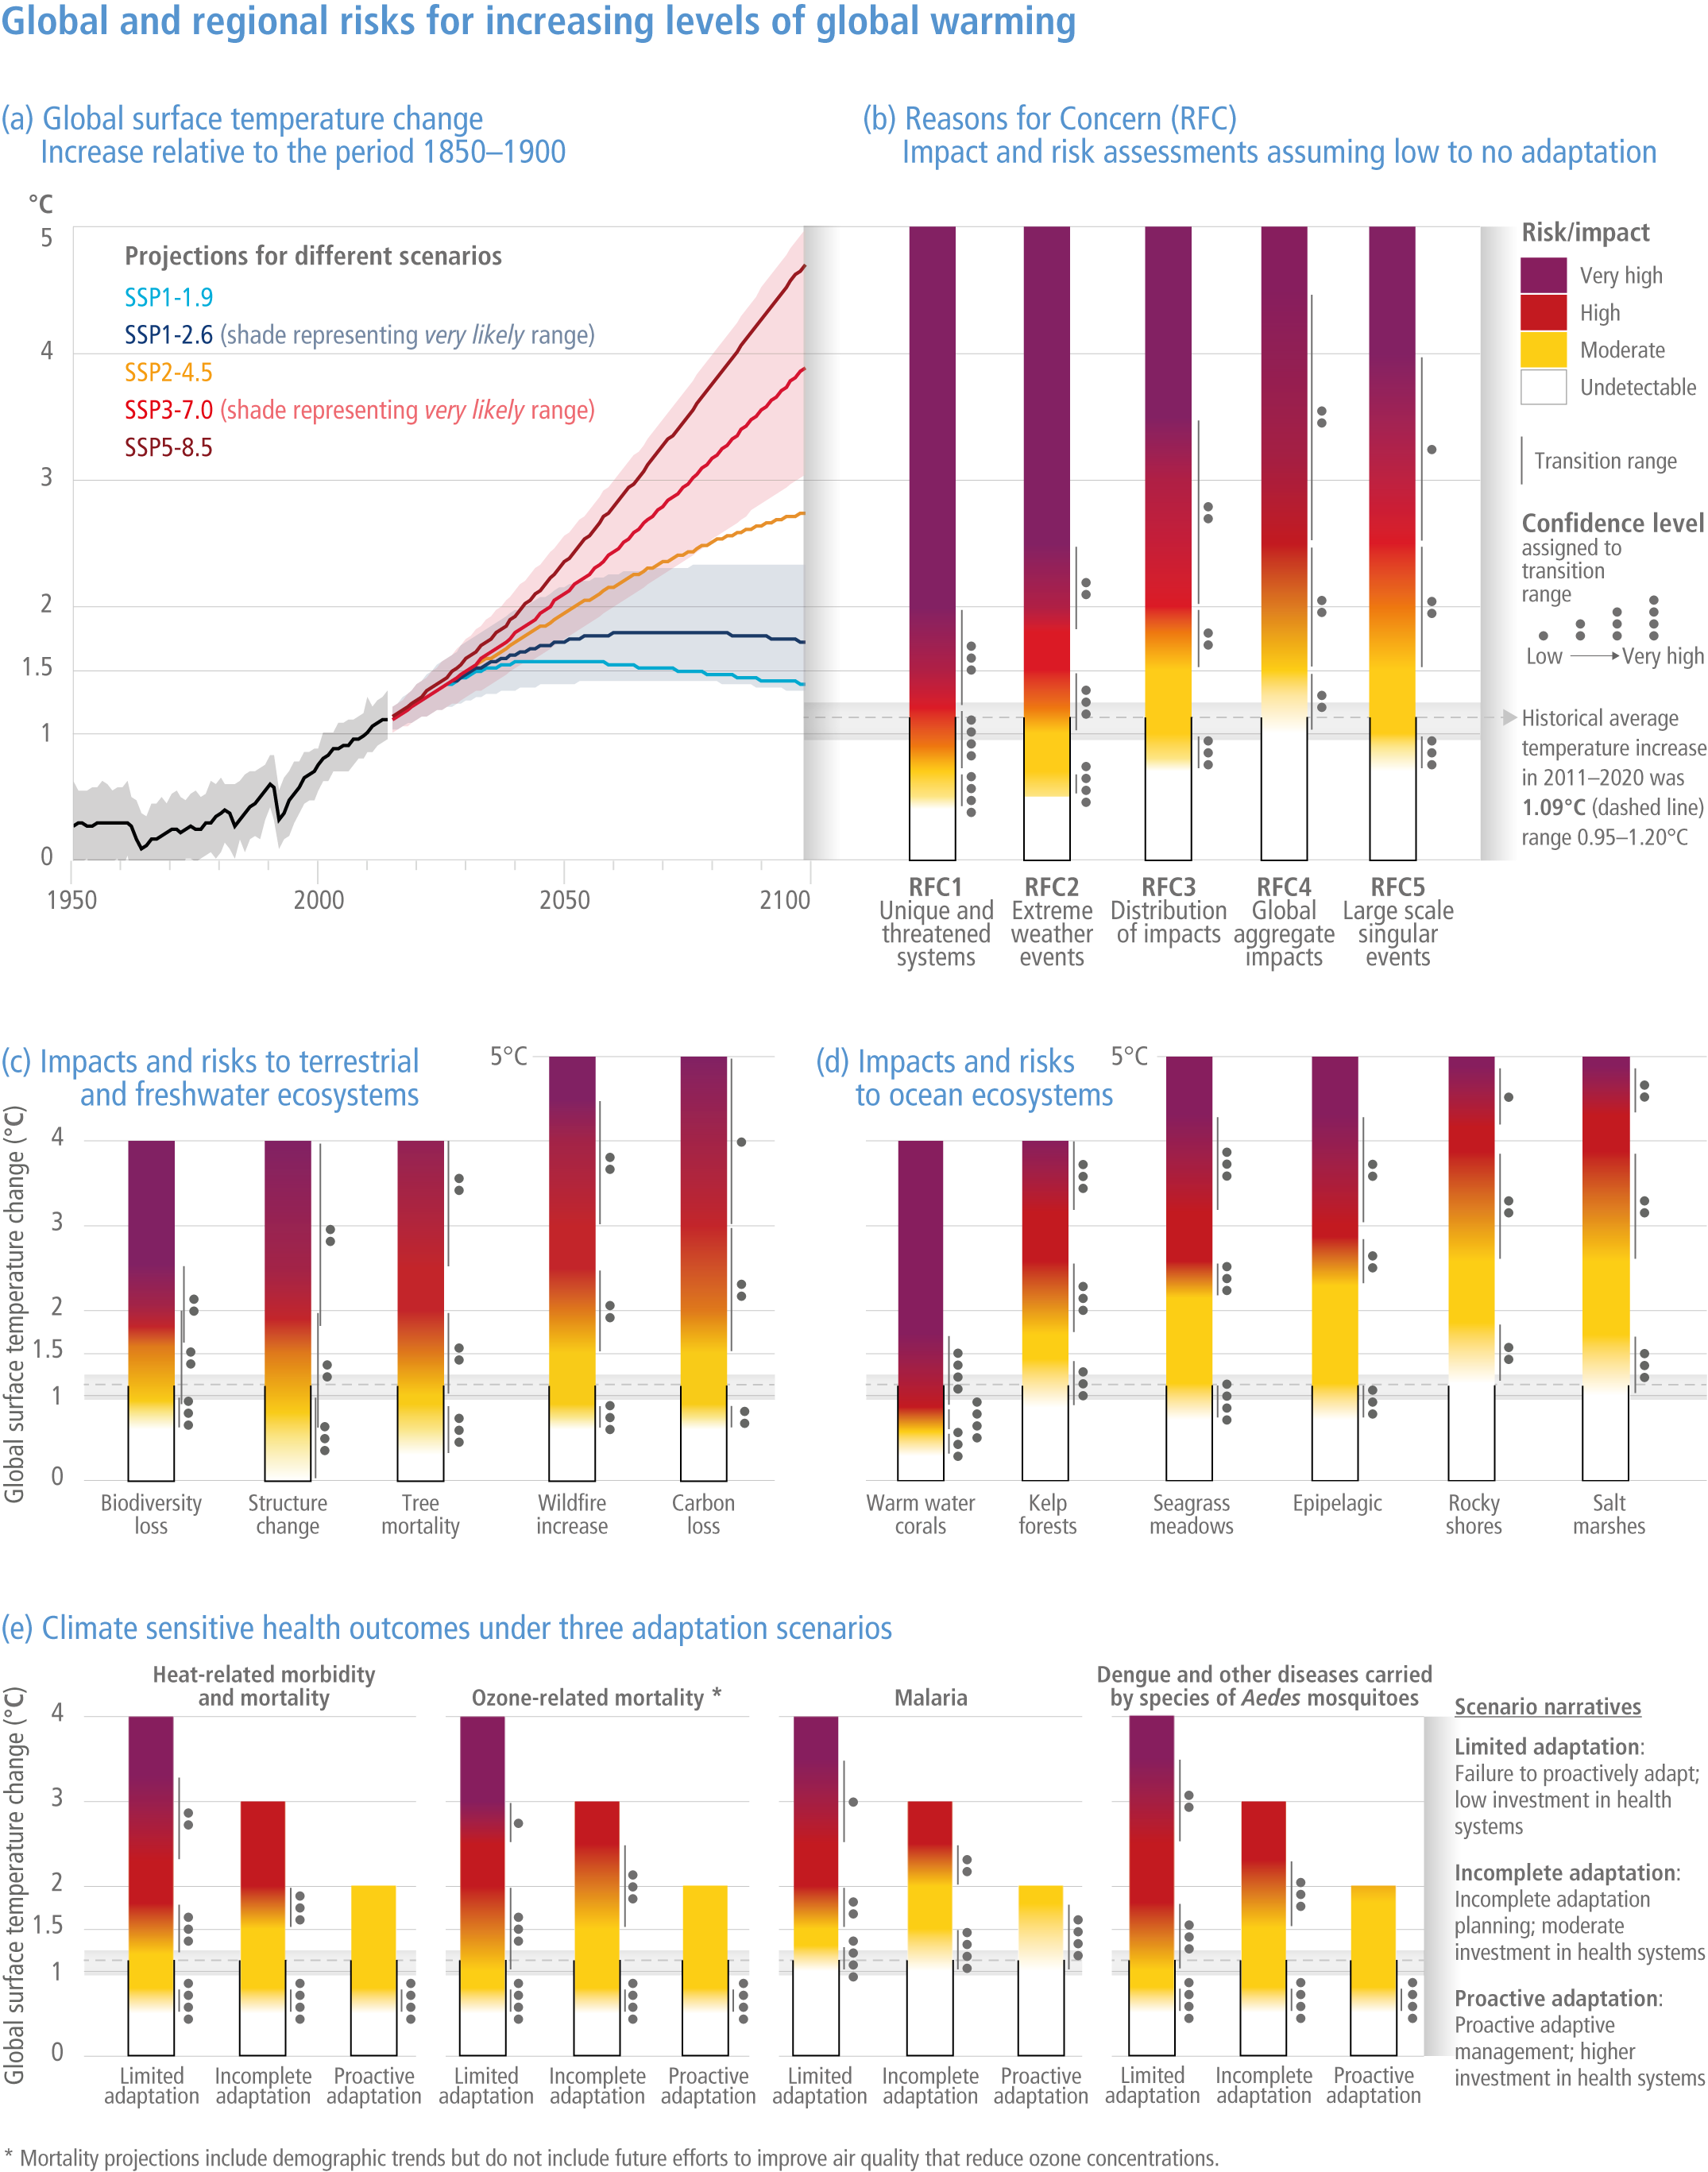
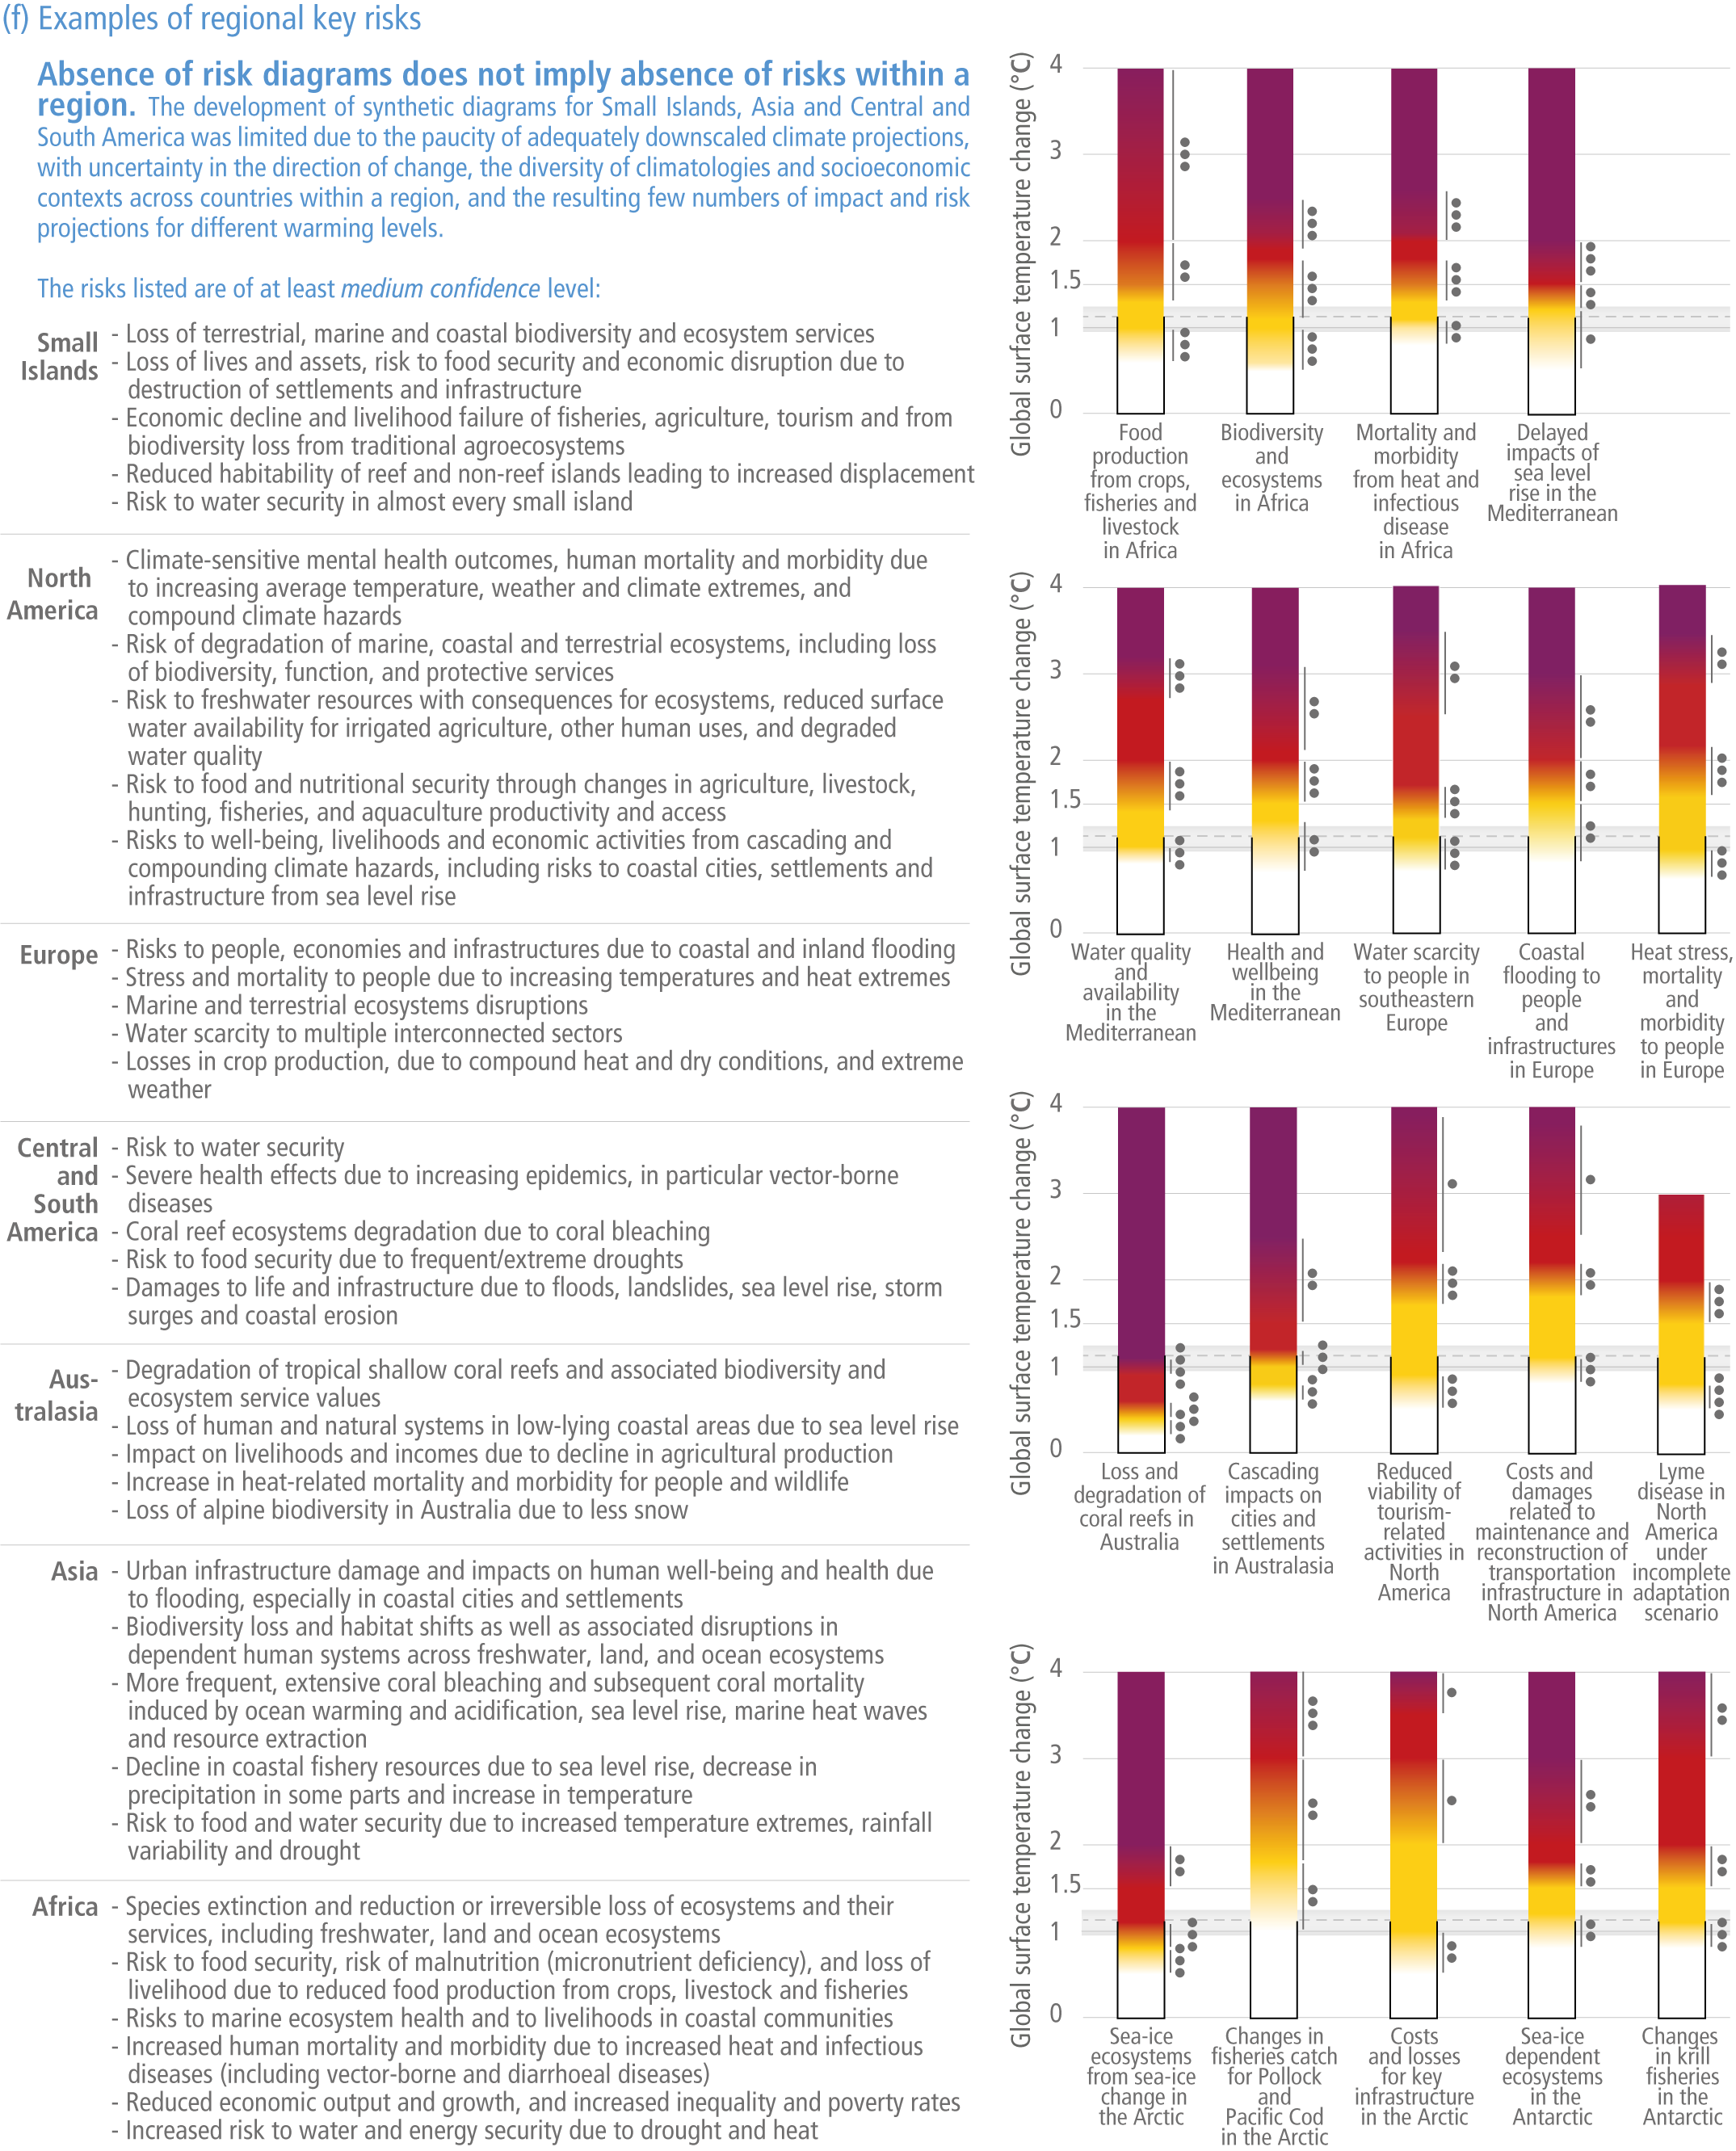
Figure SPM.3 | Synthetic diagrams of global and sectoral assessments and examples of regional key risks. Diagrams show the change in the levels of impacts and risks assessed for global warming of 0–5°C global surface temperature change relative to pre-industrial period (1850–1900) over the range.

