Figure Box 4.1.1
Figure caption
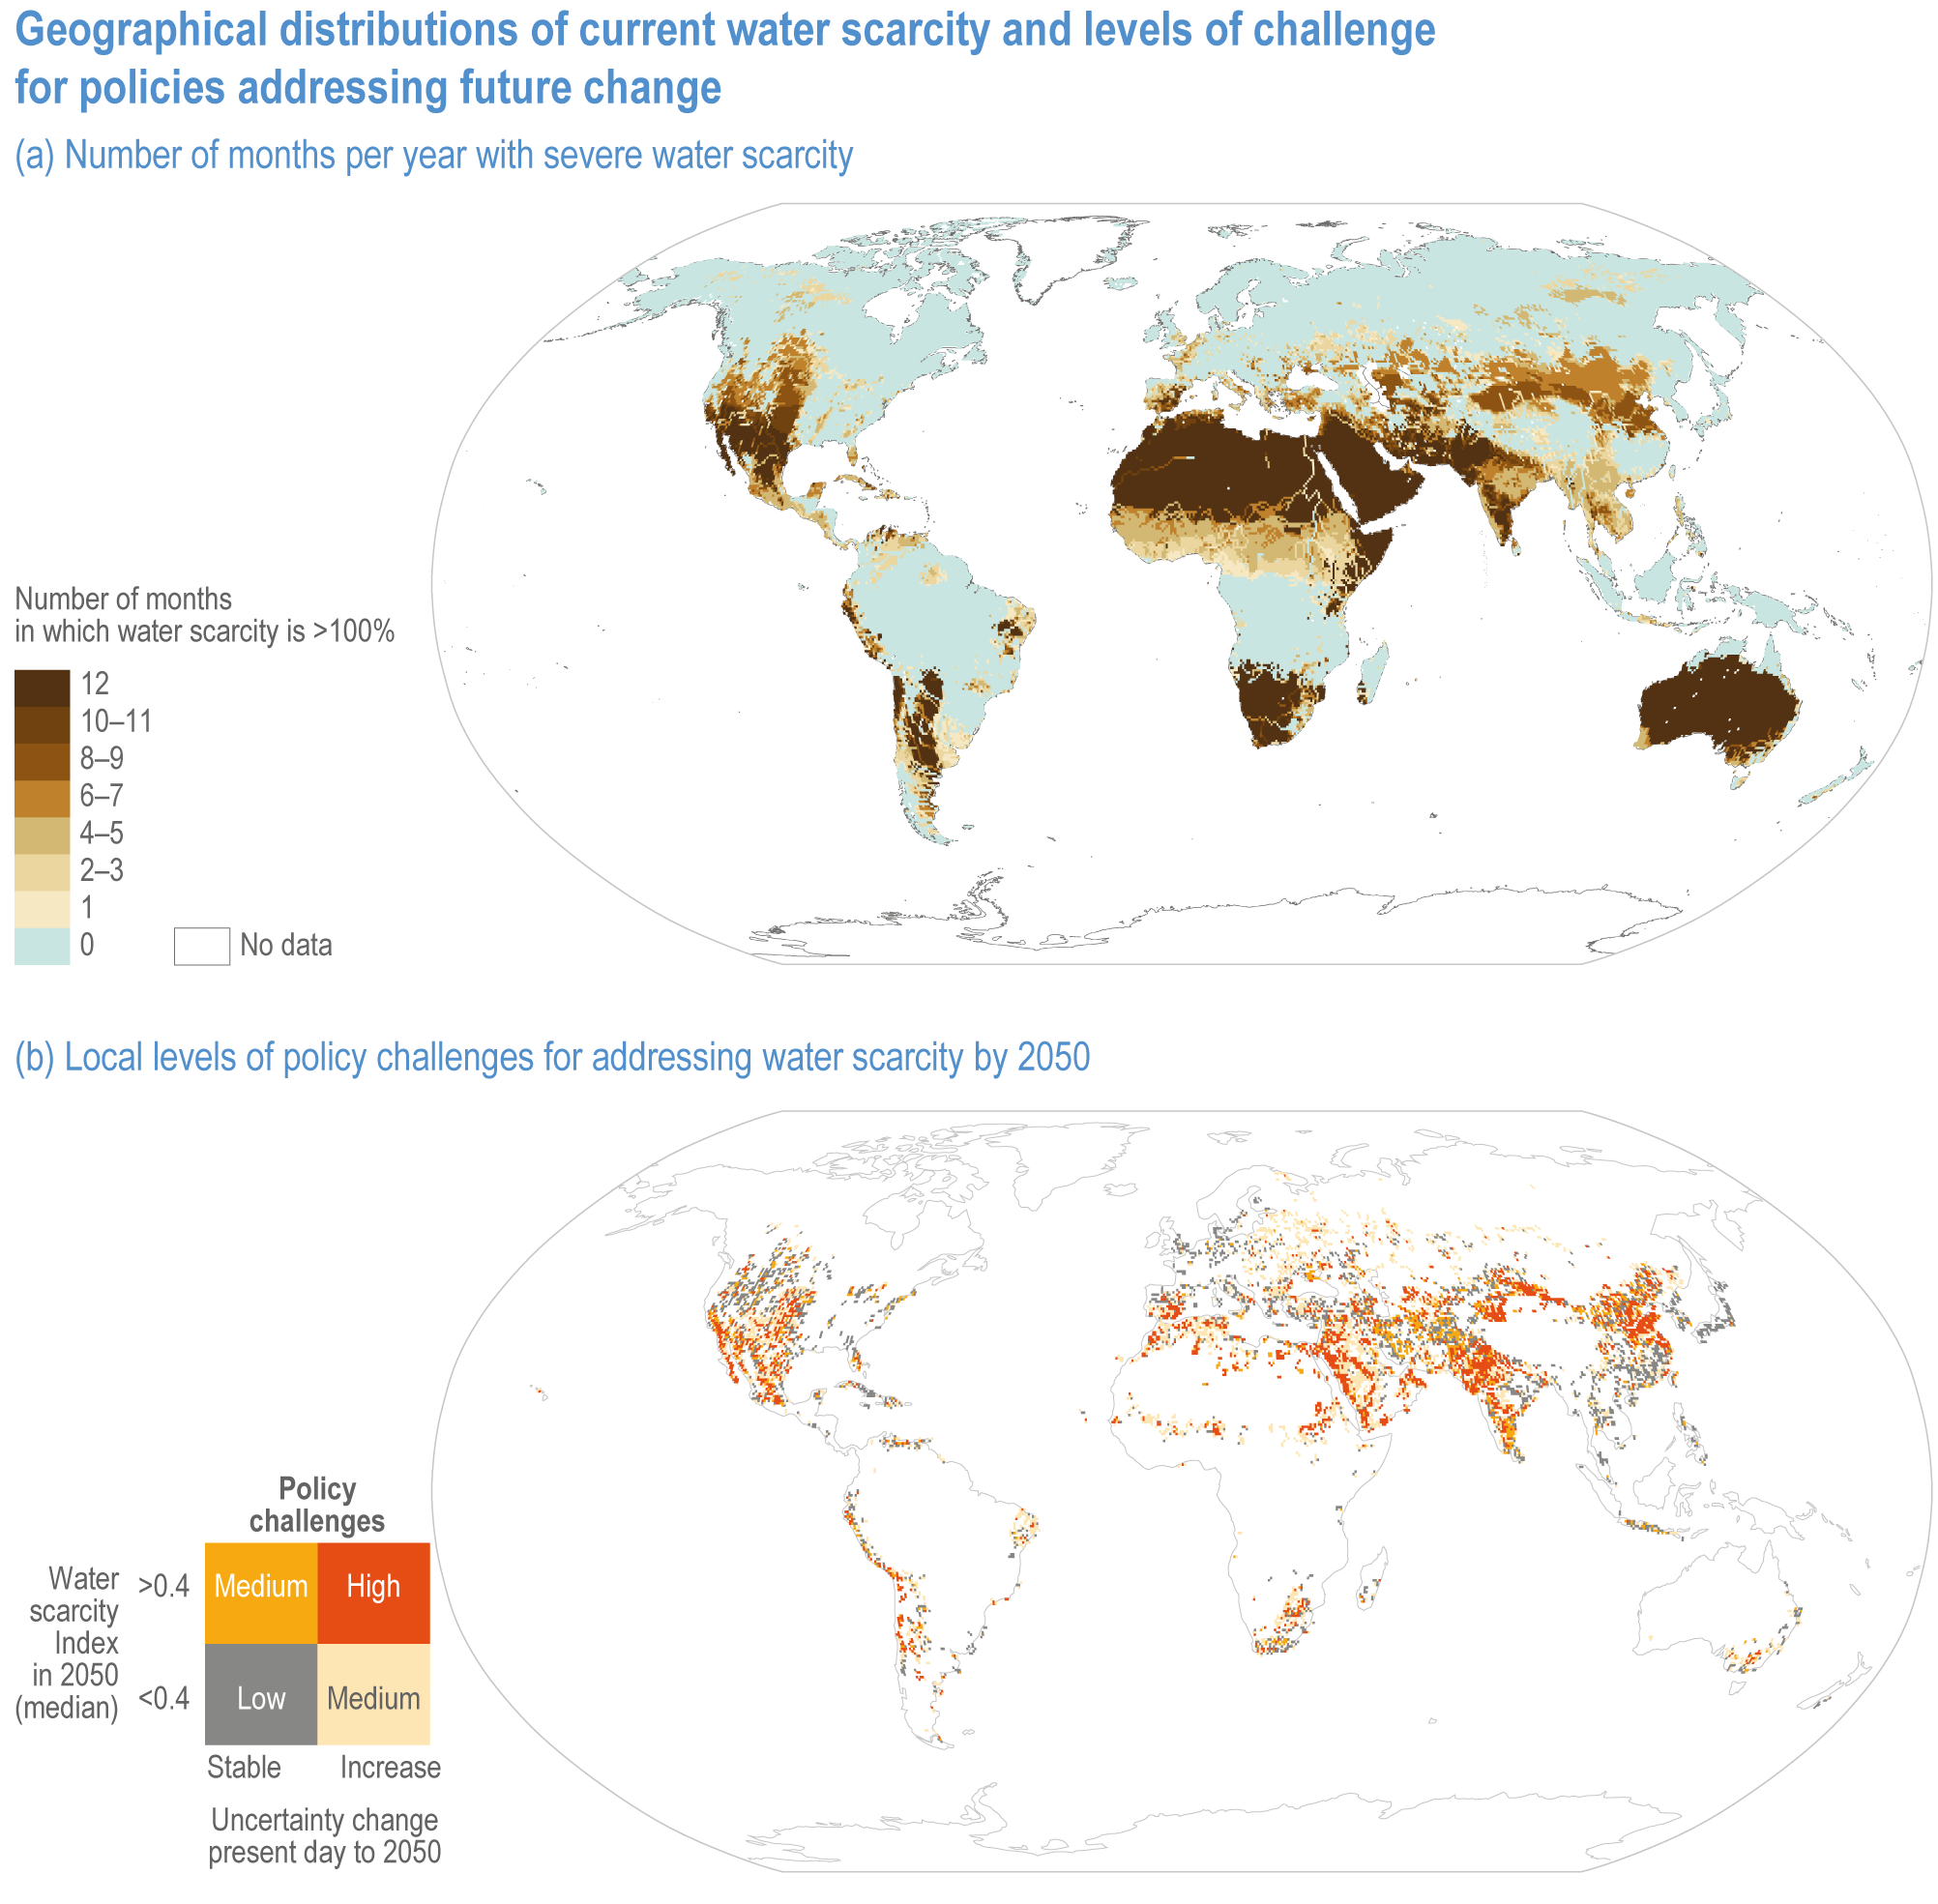
Figure Box 4.1.1 | Geographical distributions of current water scarcity and levels of challenge for policies addressing future change.
(a) The number of months per year with severe water scarcity (ratio of water demand to availability > 1.0). Reproduced from Mekonnen and Hoekstra (2016).
(b) Local levels of policy challenges for addressing water scarcity by 2050, considering both the central estimate (median) and the change uncertainty in projections of a Water Scarcity Index (WSI) from the present day to 2050 (Greve et al., 2018). Projections used five CMIP5 climate models, three global hydrological models from ISIMIP and three Shared Socioeconomic Pathways (SSPs). Levels of policy challenges refer to the scale and nature of policies to address water scarcity and range from monitoring and reviewing risks (‘low’) through transitional changes in water systems (‘medium’) to transformational changes (‘high’). Low policy challenges arise when the projected water scarcity in 2050 is lower (<0.4), and the level of uncertainty remains relatively stable in future projections. Medium policy challenge arises when either the central estimate of water scarcity remains low but uncertainty increases, or the uncertainty is stable but the central estimate of water scarcity for 2050 is higher (>0.4). High policy challenges arise when the central estimate of water scarcity is higher and the uncertainty increases. White areas show grid points defined as non-water-scarce (75th quantile of the WSI < 0.1 at all times) or very low average water demand. Reproduced from Greve et al. (2018).
