Back chapter figures
Figure 18.6
Figure caption
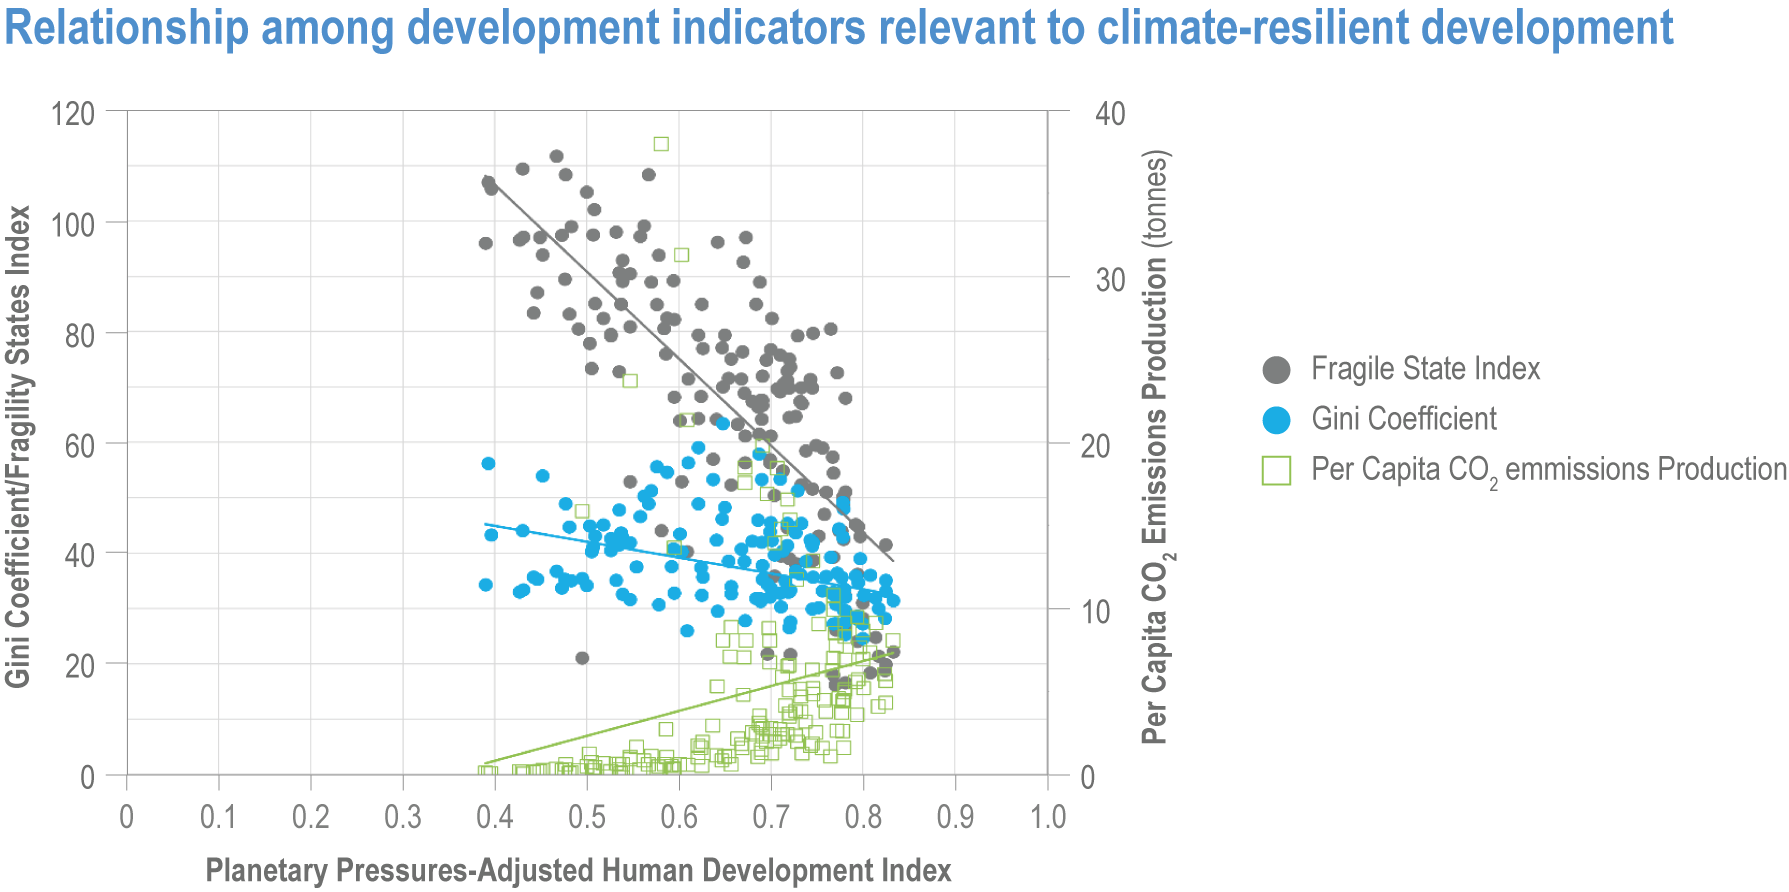
Figure 18.6 | This figure presents National Gini coefficients (most recent year available; n = 141 (World Bank, 2021), the Fragile States Index (2021; n = 163; (Fund for Peace, 2021), and per capita CO2 emissions (2018; n = 169), Human Development Report Office, 2020) plotted against the Planetary Pressures-Adjusted Human Development Index (2020, n = 163 (Human Development Report Office, 2020)
