Back chapter figures
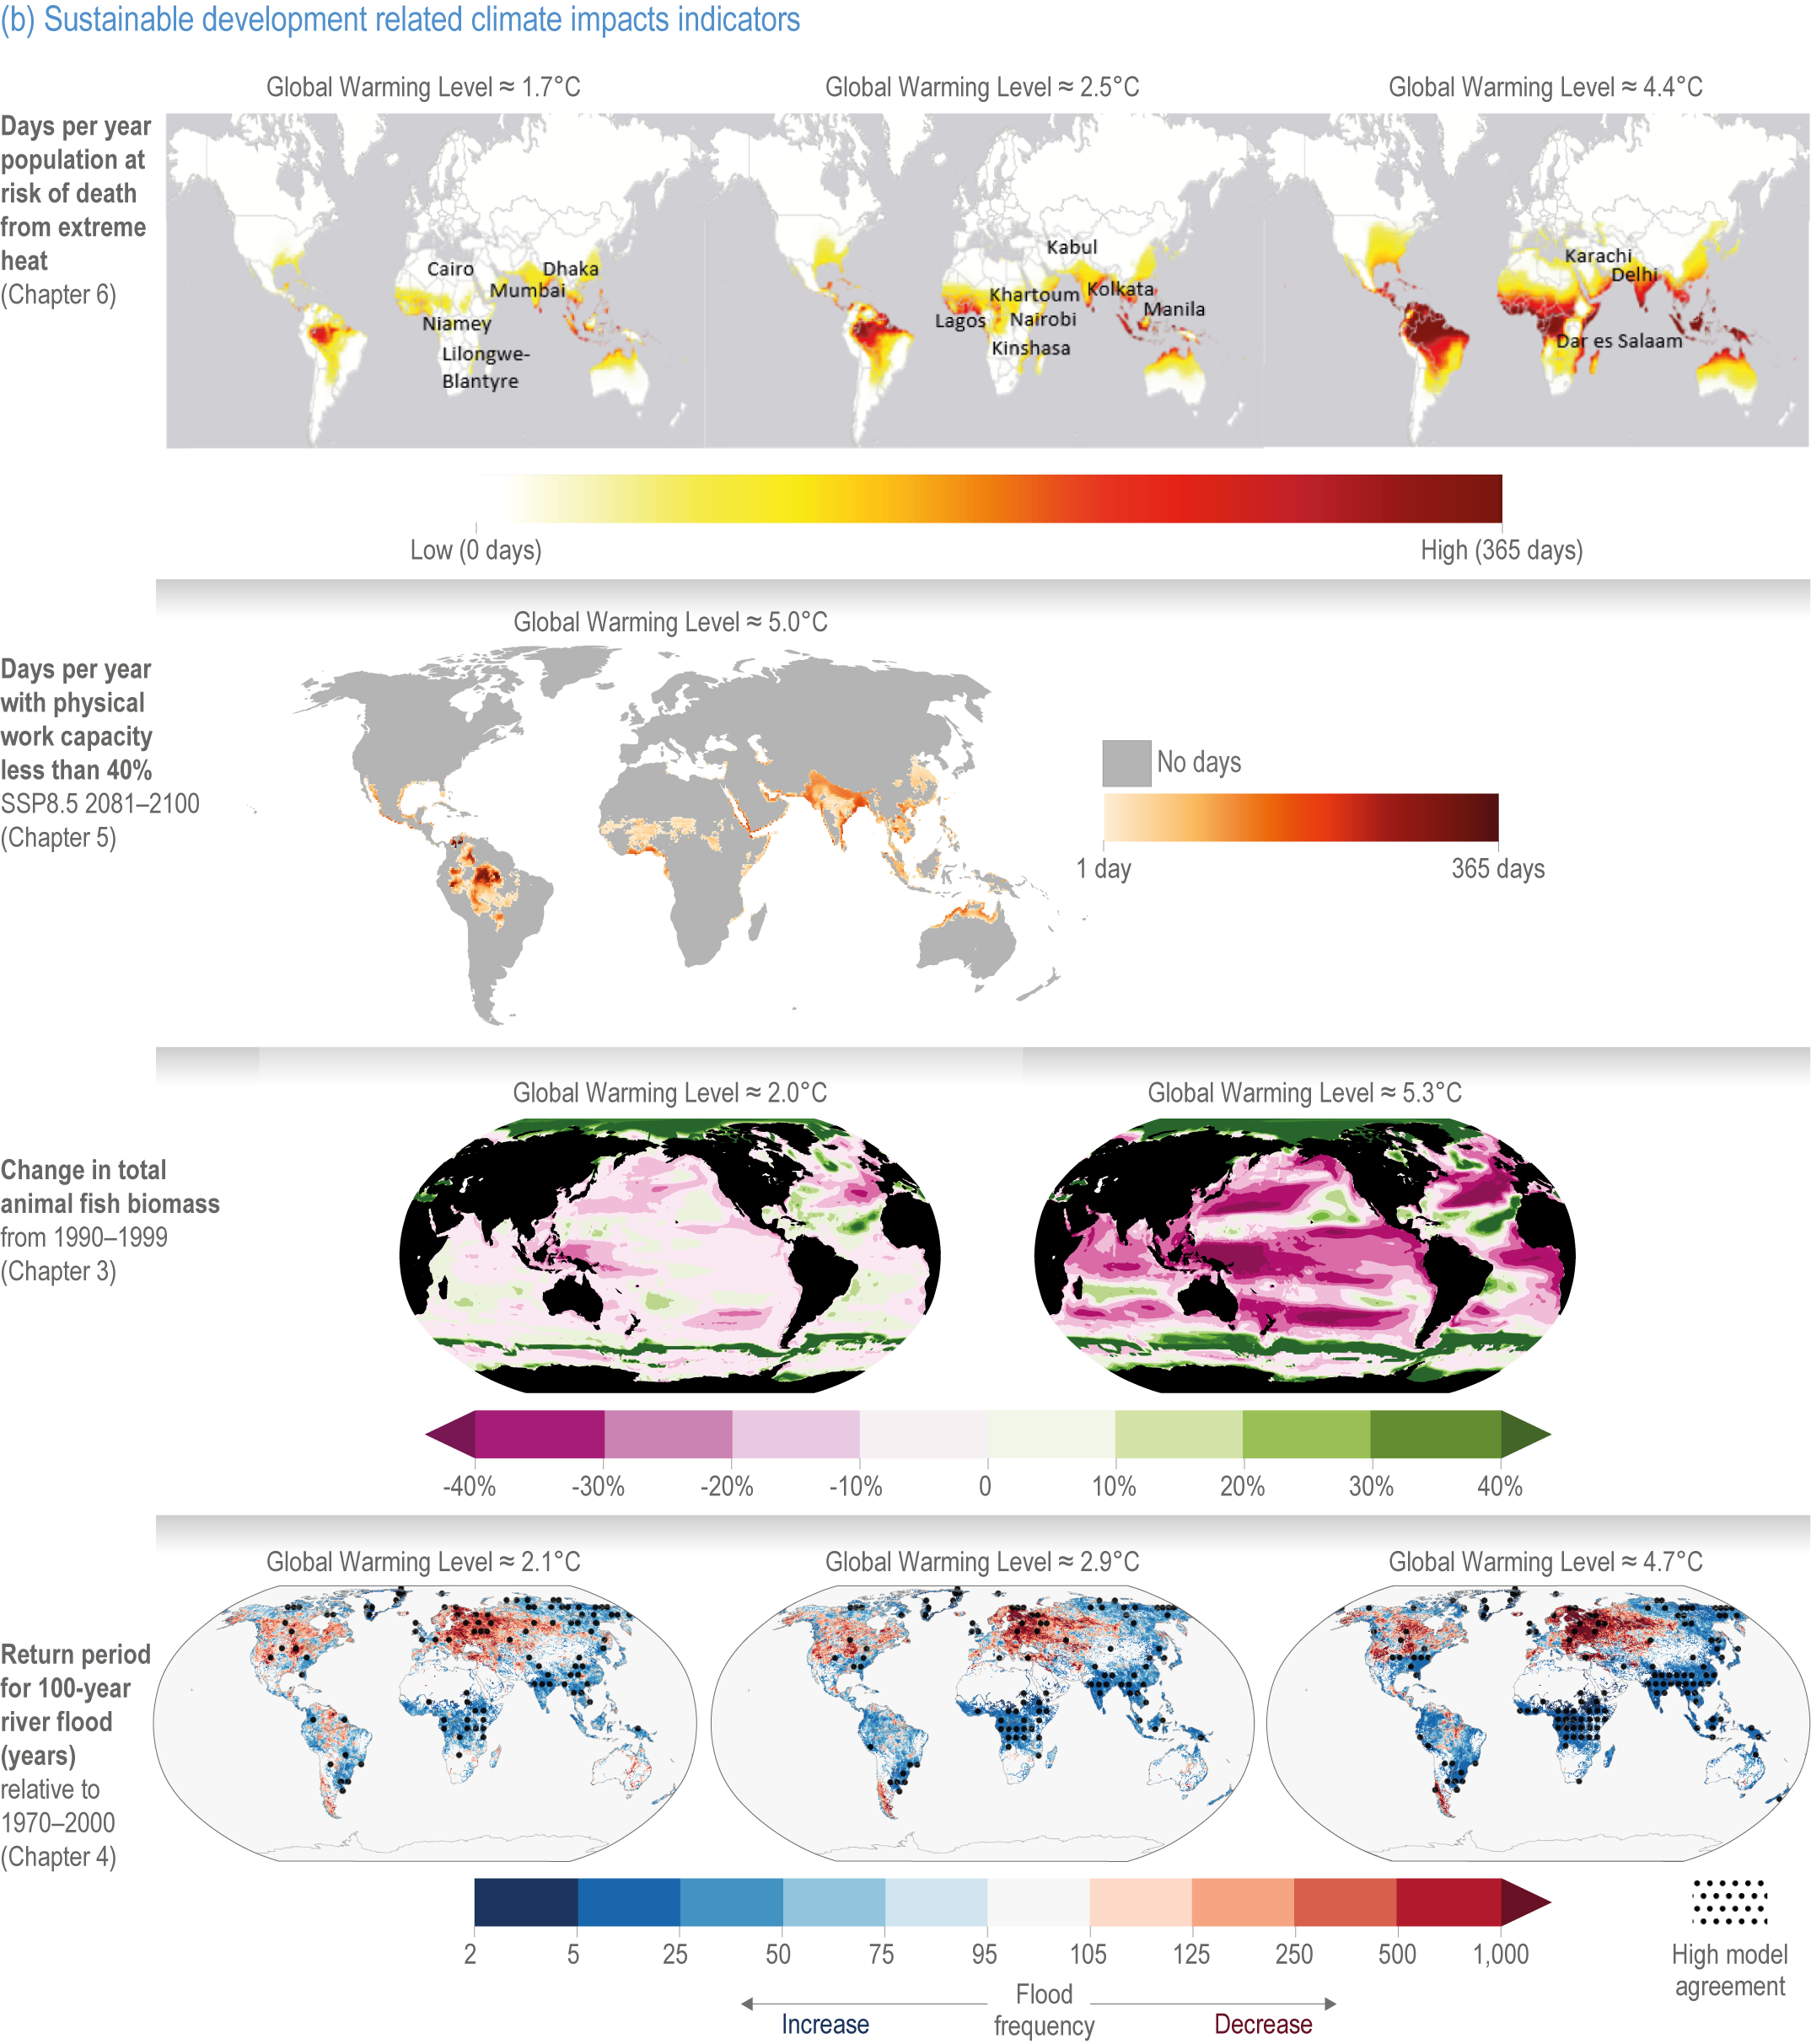
Figure 18.4
Figure caption
Figure 18.4 | Regional projected select climate change and sustainable-development-related climate impact indicators by global warming level. Sources: WGI AR6 Interactive Atlas (https://interactive-atlas.ipcc.ch/) and WGII Figures 3.21, 4.17, 5.19, and 6.3. The GWLs shown are multi-model means derived from Hauser et al. (2019) for the respective RCP and SSP and time periods associated with each figure.
