Back chapter figures
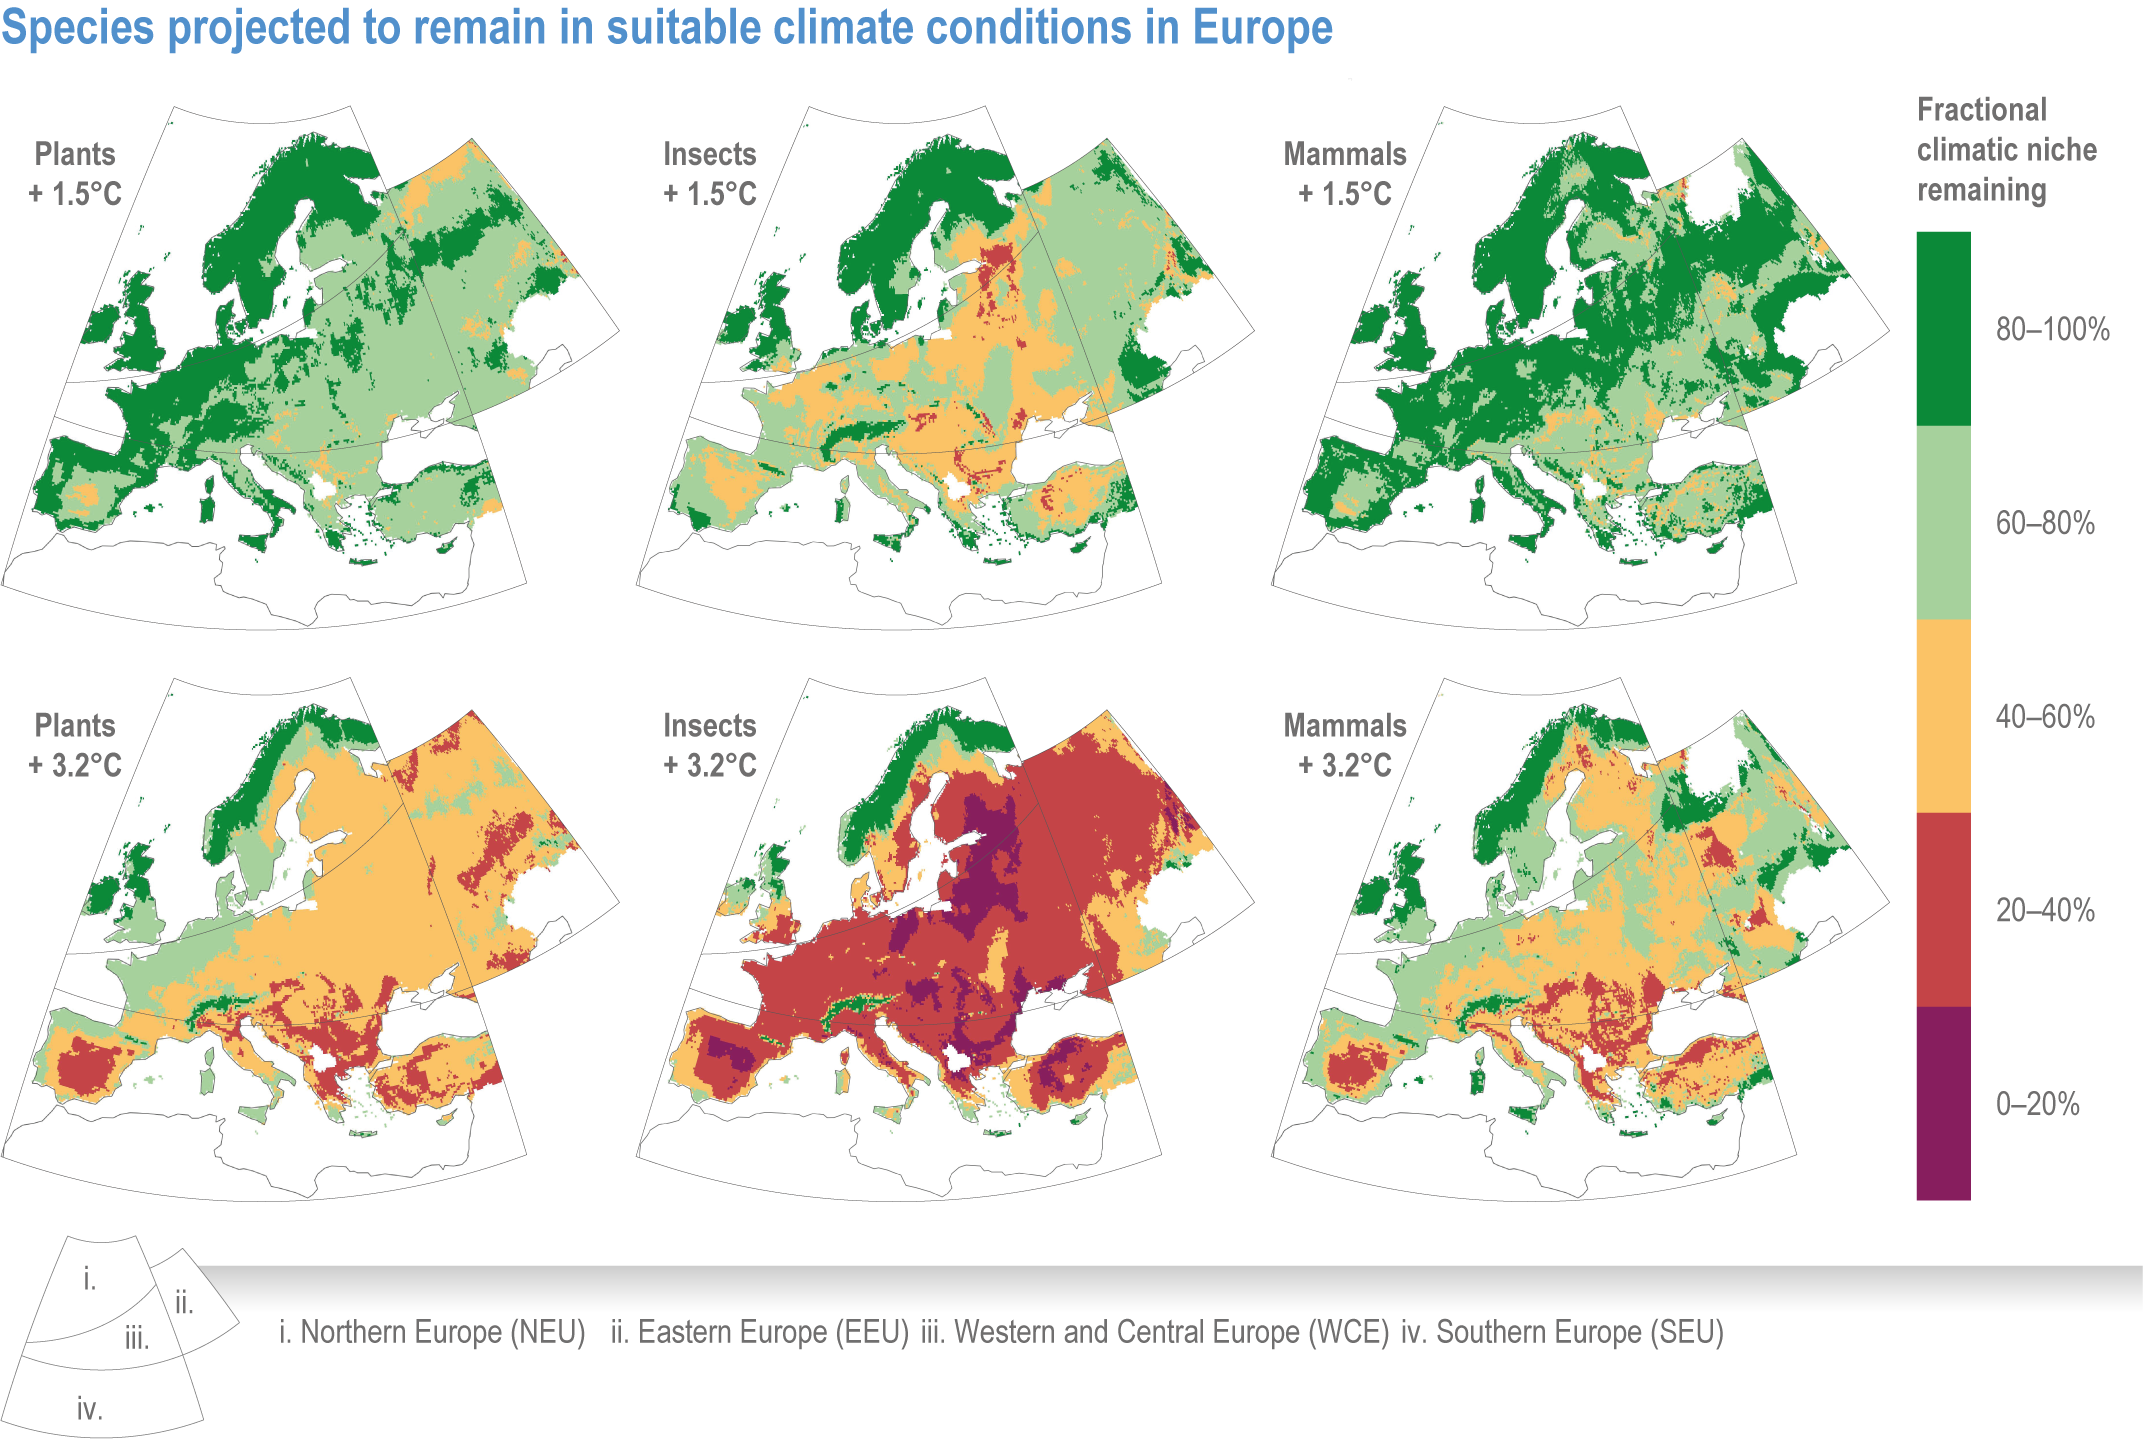
Figure 13.9
Figure caption
Figure 13.9 | Species projected to remain within their suitable climate conditions at increasing levels of climate change. Colour shading represents the proportion of species projected to remain within their suitable climates averaged over 21 CMIP5 climate models (Warren et al., 2018). Areas shaded in green retain a large number of species with suitable climate conditions, while those in purple represent areas where climates become unsuitable for more than 80% of species without dispersal (Table SM13.3).
