Back chapter figures
Figure TS.24
Figure caption
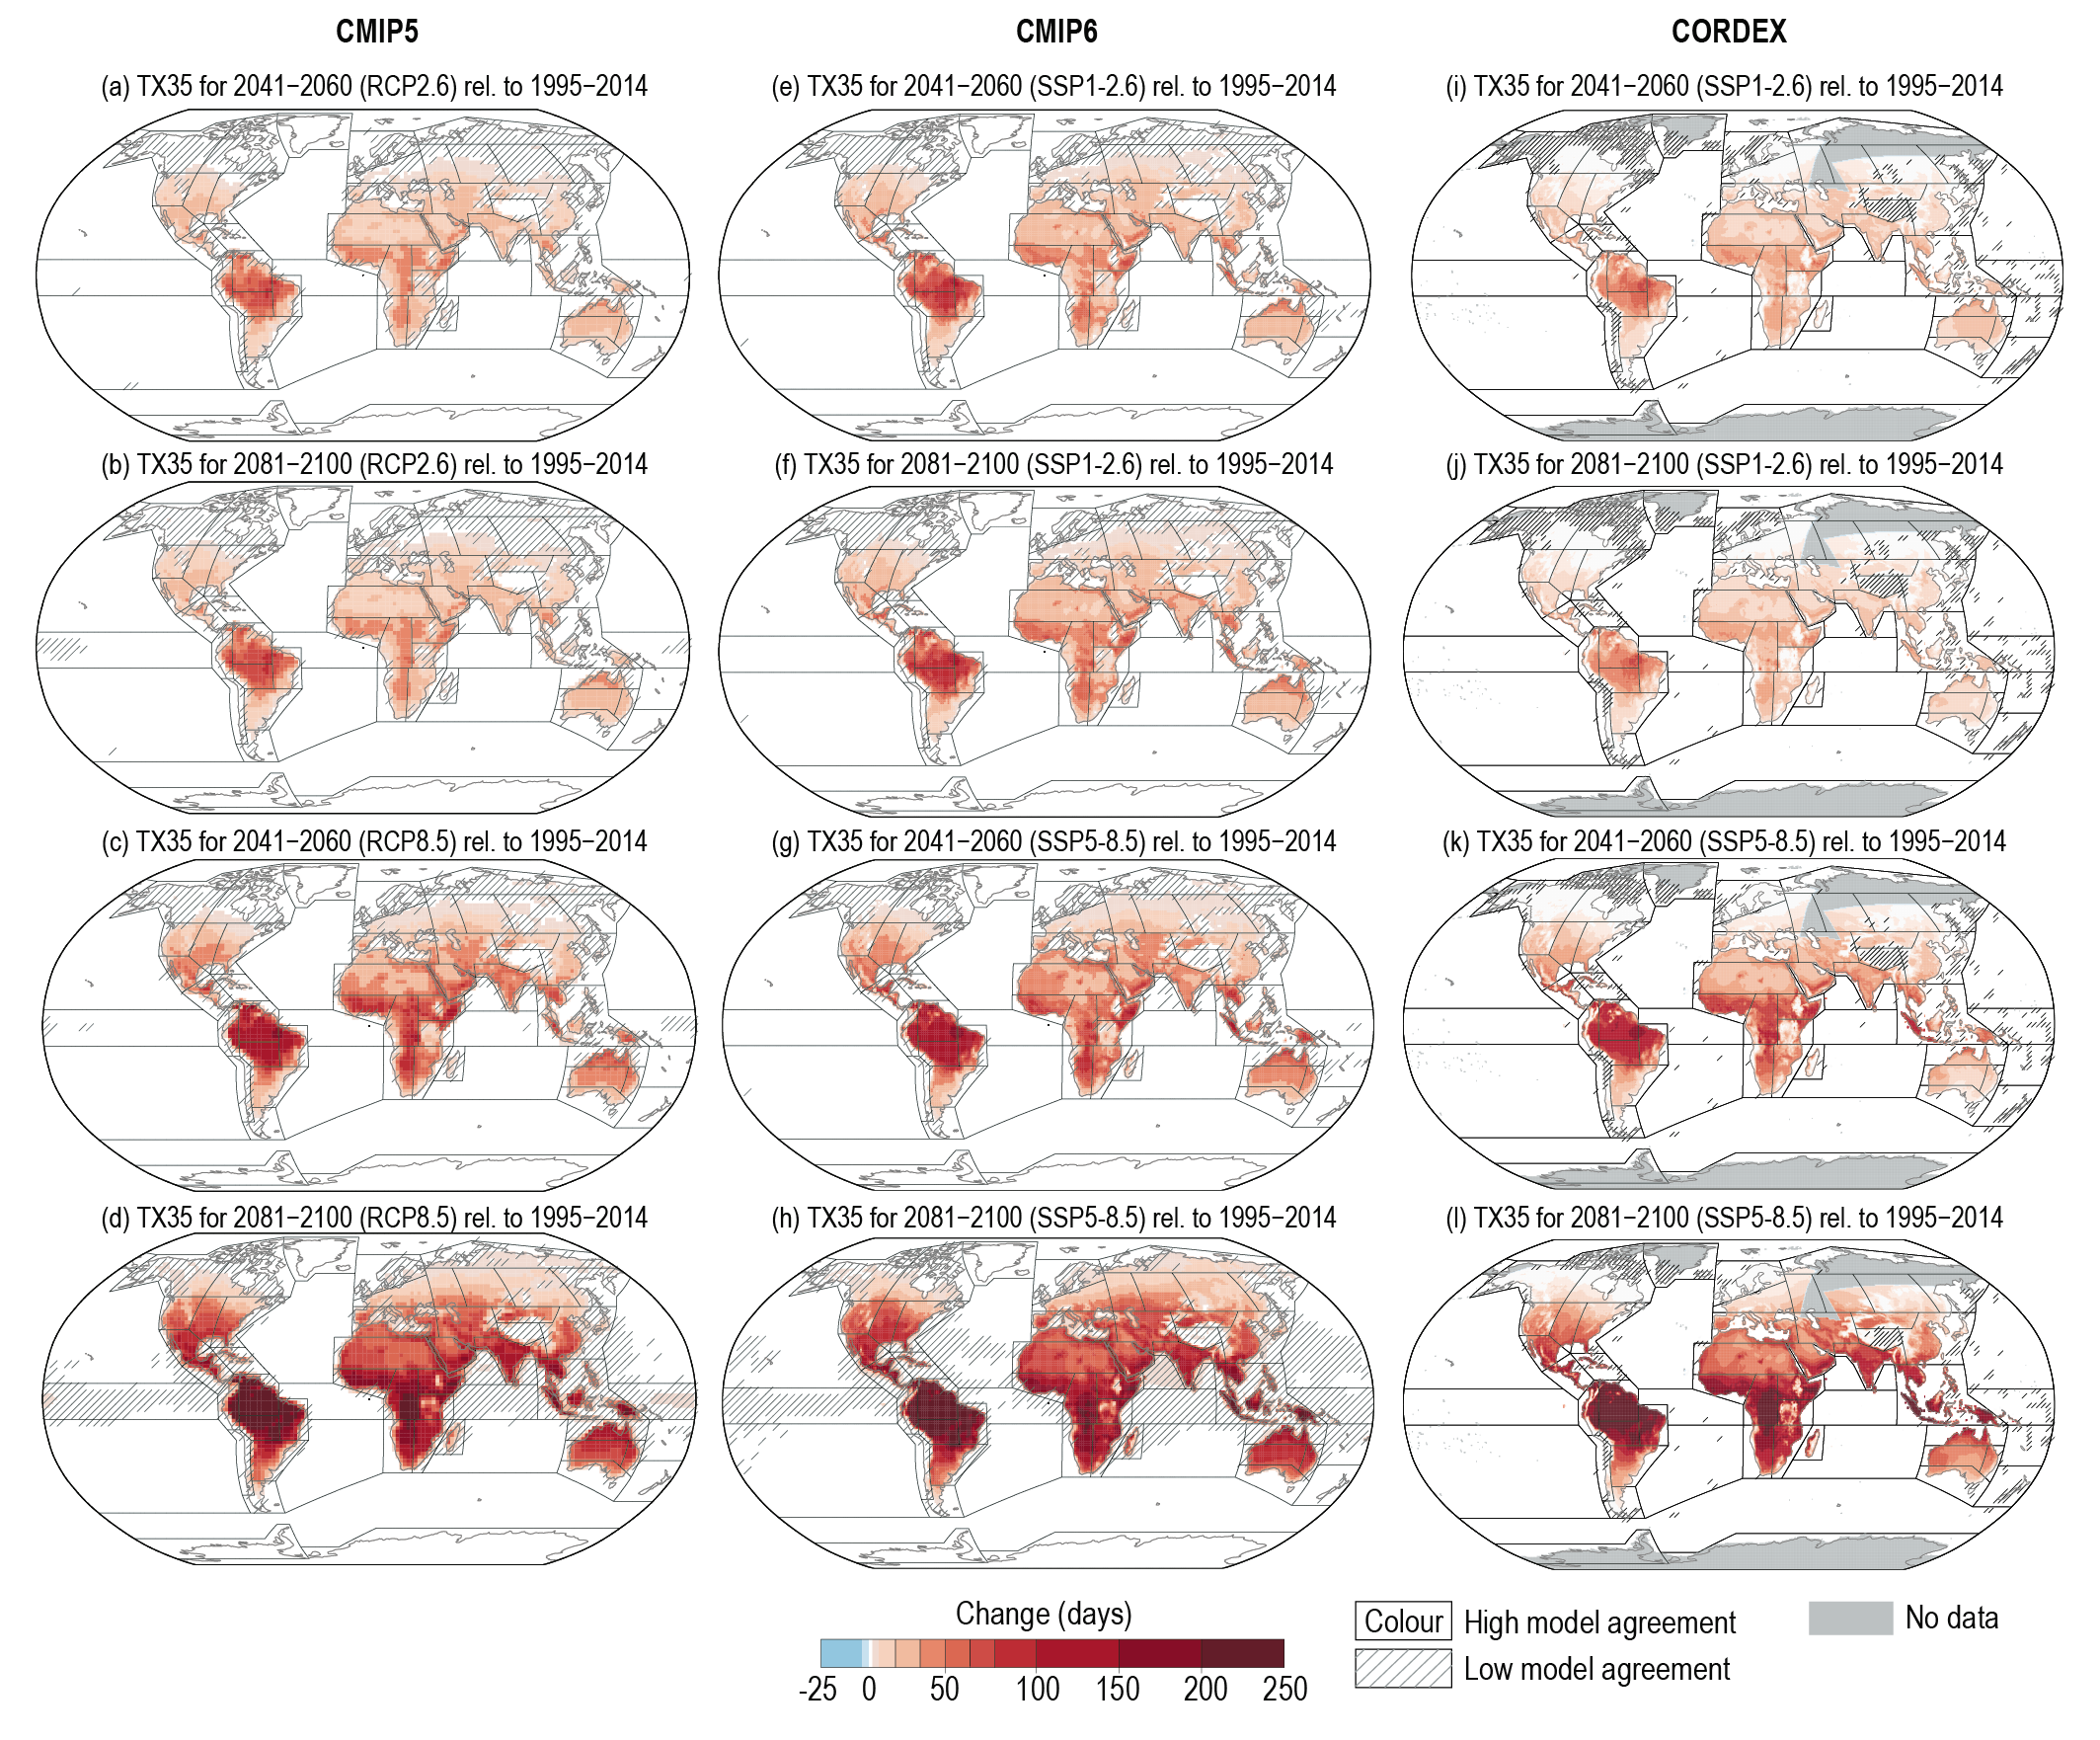
Figure TS.24 | Projected change in the mean number of days per year with maximum temperature exceeding 35°C for Coupled Model Intercomparison Project Phase 5 (CMIP5; first column), Phase 6 (CMIP6; second column) and Coordinated Regional Climate Downscaling Experiment (CORDEX; third column) ensembles. The intent of this figure is to show that there is a consistent message about the patterns of projected change in extreme daily temperatures from the CMIP5, CMIP6 and CORDEX ensembles. The map shows the median change in the number of days per year between the mid-century (2041–2060) or end-century (2081–2100) and historical (1995–2014) periods for the CMIP5 and CORDEX RCP8.5 and RCP2.6 scenario ensembles and the CMIP6 SSP5-8.5 and SSP1-2.6 scenario ensembles. Hatching indicates areas where less than 80% of the models agree on the sign of change. {Interactive Atlas}
