Back chapter figures
Figure TS.19
Figure caption
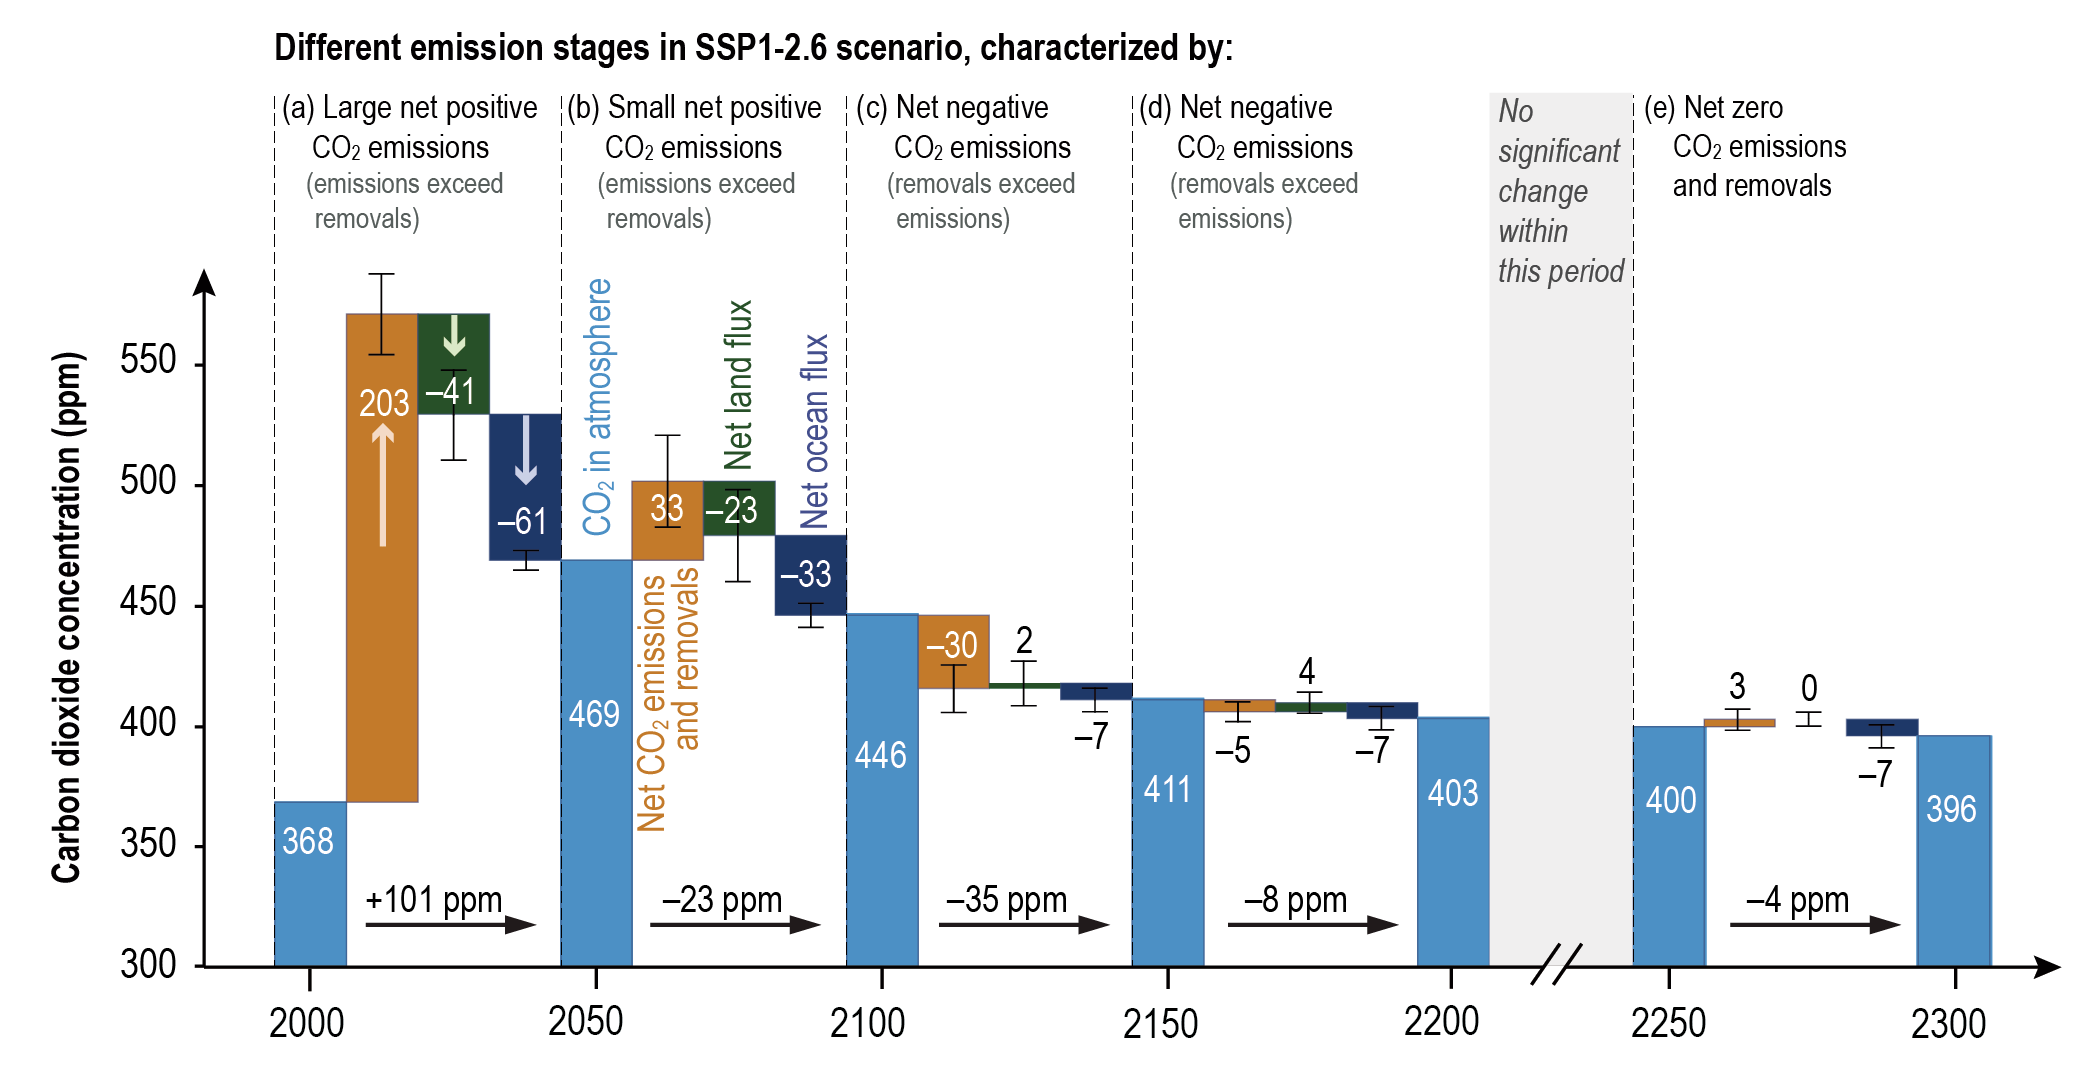
Figure TS.19 | Carbon sink response in a scenario with net carbon dioxide (CO2) removal from the atmosphere. The intent of this figure is to show how atmospheric CO2 evolves under negative emissions and its dependence on the negative emissions technologies. It also shows the evolution of the ocean and land sinks. Shown are CO2flux components from concentration-driven Earth system model (ESM) simulations during different emissions stages of SSP1–2.6 and its long-term extension. (a) Large net positive CO2 emissions, (b) small net positive CO2 emissions, (c–d) net negative CO2 emissions, and (e) net zero CO2 emissions. Positive flux components act to raise the atmospheric CO2 concentration, whereas negative components act to lower the CO2 concentration. Net CO2 emissions and land and ocean CO2 fluxes represent the multi-model mean and standard deviation (error bar) of four ESMs (CanESM5, UKESM1, CESM2-WACCM, IPSL-CM6a-LR) and one Earth system model of intermediate complexity (Uvic ESCM). Net CO2 emissions are calculated from concentration-driven ESM simulations as the residual from the rate of increase in atmospheric CO2 and land and ocean CO2 fluxes. Fluxes are accumulated over each 50-year period and converted to concentration units (parts per million, or ppm). {5.6.2.1, Figure 5.33}
