Back chapter figures
Figure TS.16
Figure caption
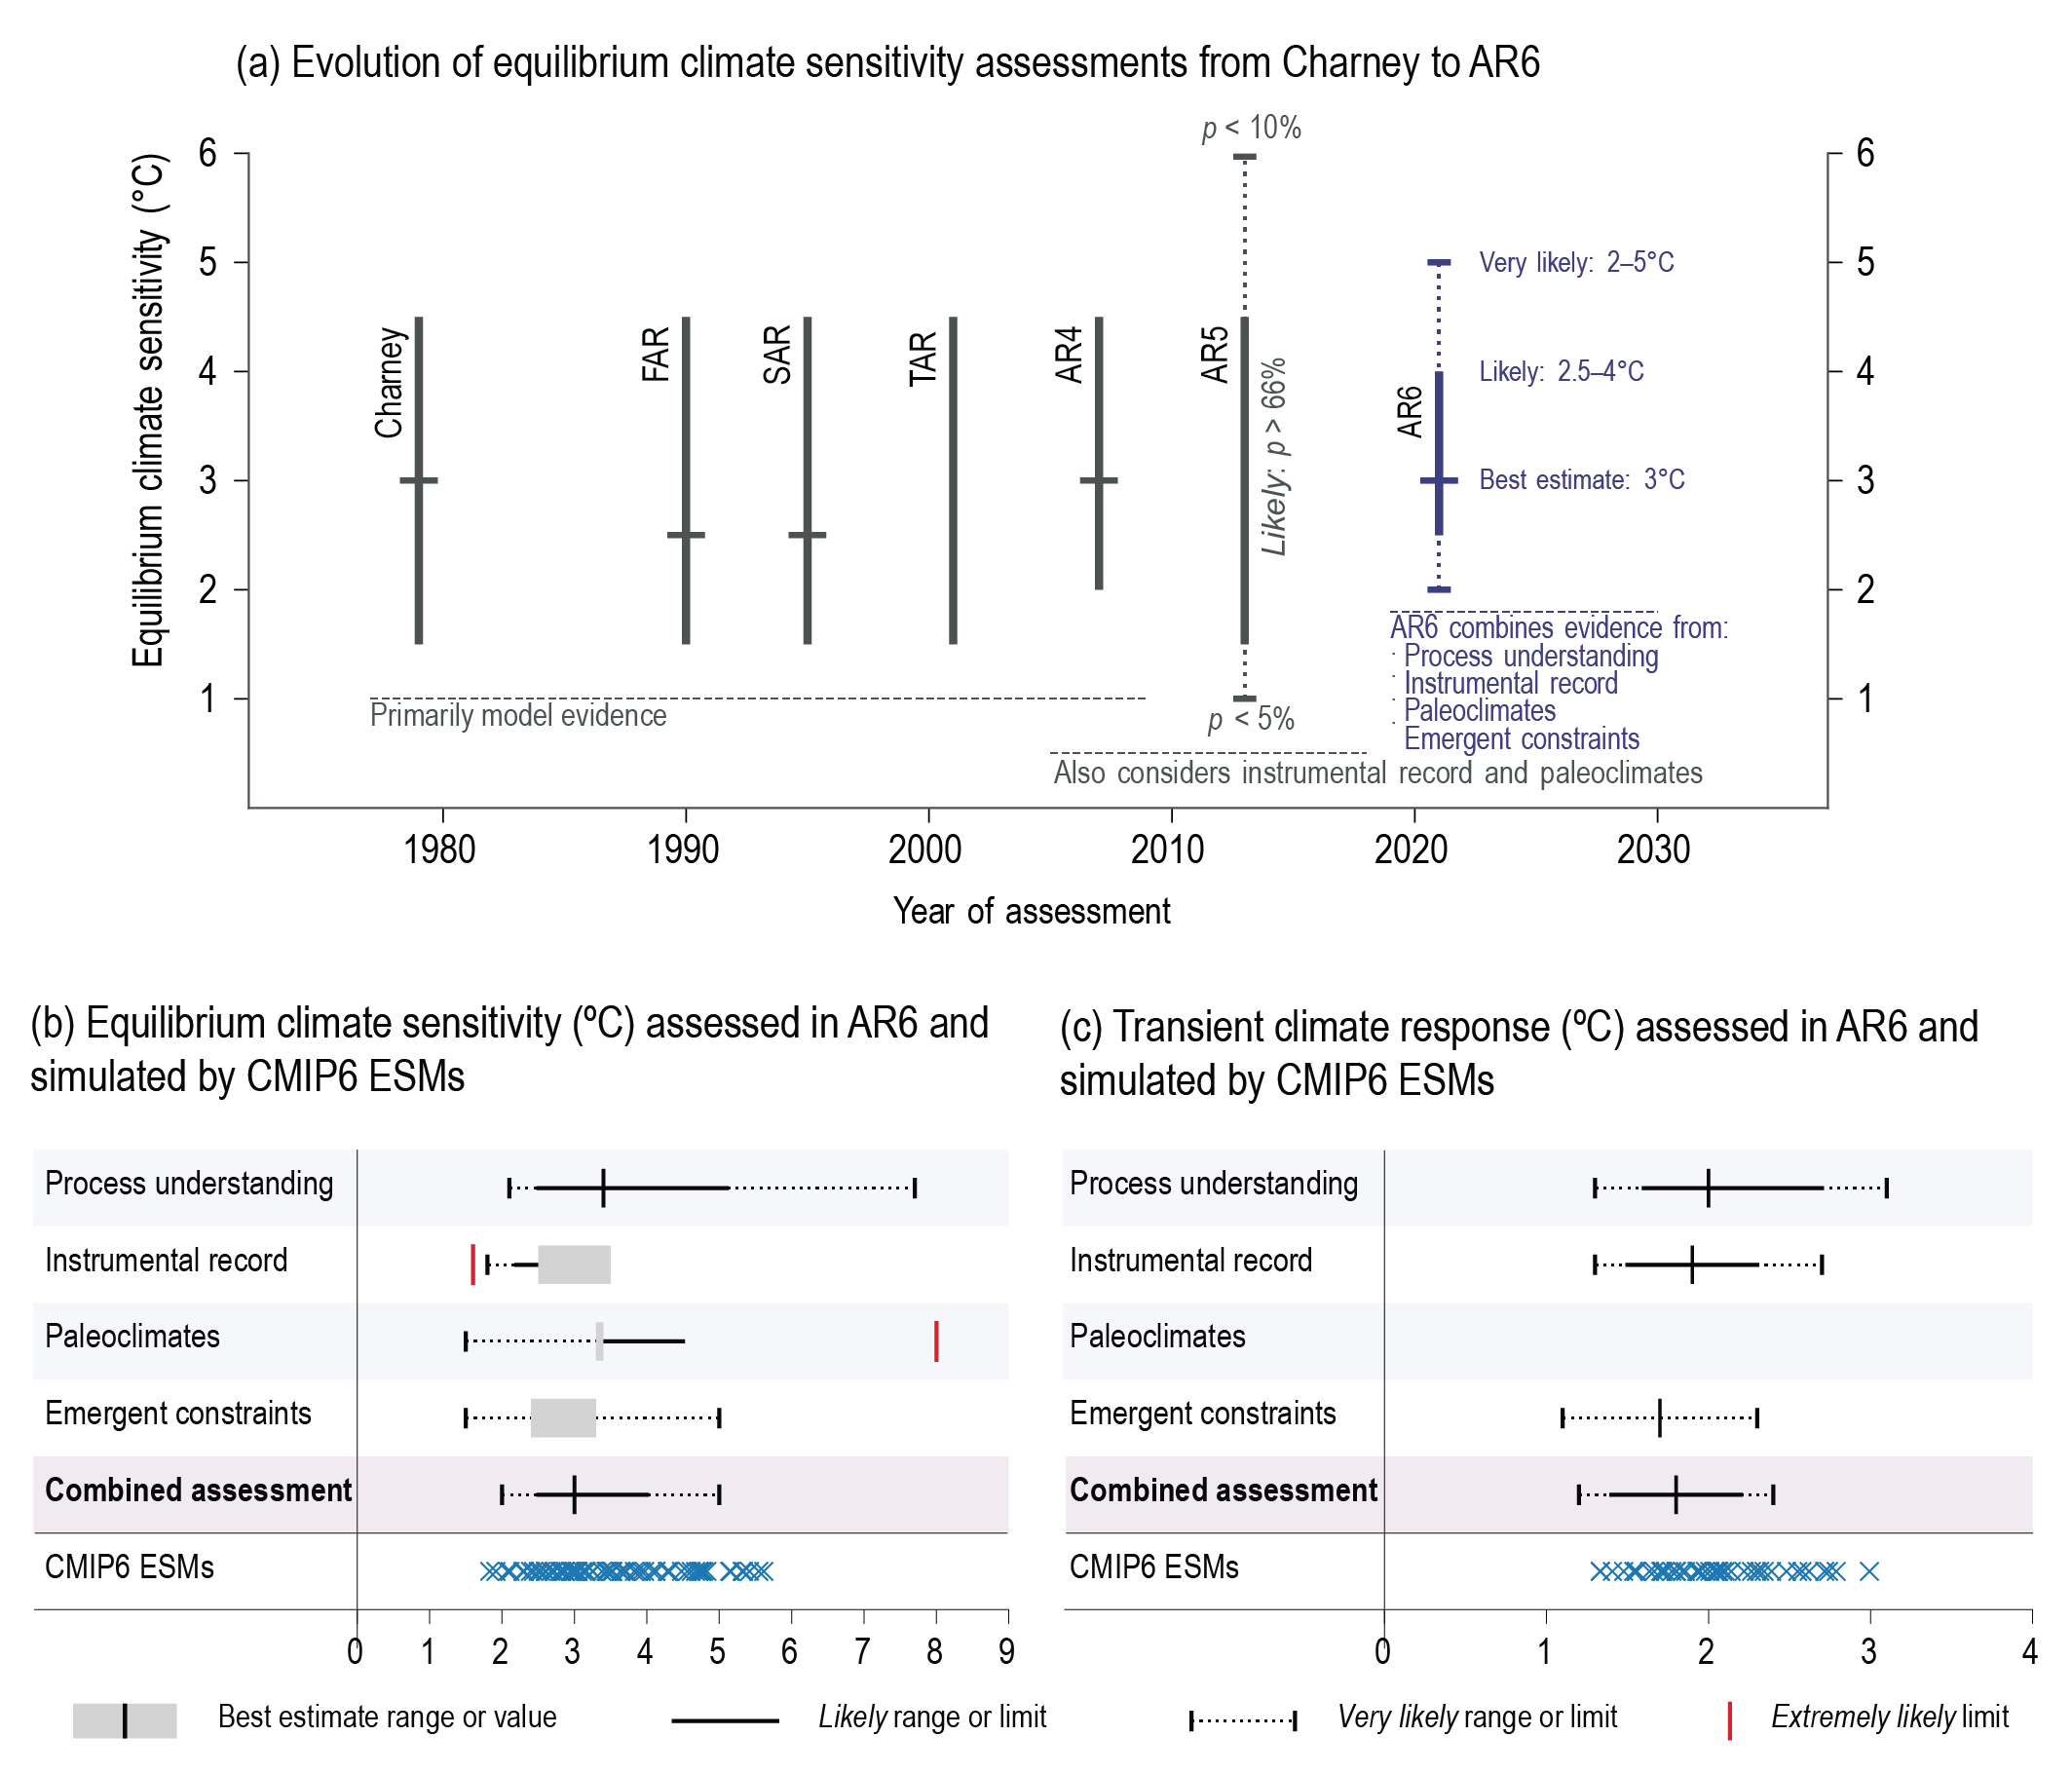
Figure TS.16 | (a) Evolution of equilibrium climate sensitivity (ECS) assessments from the Charney Report through a succession of IPCC Assessment Reports to AR6, and lines of evidence and combined assessment for (b) ECS and (c) transient climate response (TCR) in AR6. The intent of this figure is to show the progression in estimates of ECS, including uncertainty and the lines of evidence used for assessment, and to show the lines of assessment used to assess ECS and TCR in AR6. In panel (a), the lines of evidence considered are listed below each assessment. Best estimates are marked by horizontal bars, likely ranges by vertical bars, and very likely ranges by dotted vertical bars. In panel (b) and (c), assessed ranges are taken from Tables 7.13 and 7.14 for ECS and TCR respectively. Note that for the ECS assessment based on both the instrumental record and paleoclimates, limits (i.e., one-sided distributions) are given, which have twice the probability of being outside the maximum/minimum value at a given end, compared to ranges (i.e., two tailed distributions) which are given for the other lines of evidence. For example, the extremely likely limit of greater than 95% probability corresponds to one side of the very likely (5% to 95%) range. Best estimates are given as either a single number or by a range represented by grey box. Coupled Model Intercomparison Project Phase 6 (CMIP6) Earth system model (ESM) values are not directly used as a line of evidence but are presented on the figure for comparison. {1.5, 7.5; Tables 7.13 and 7.14; Figure 7.18}
